Monitor Functions
26 May 2023


A few weeks ago, we released our first iteration of the metrics feature. We are excited to announce that this feature is about to become even better! If you are using our functions, you can now use our metrics dashboard to see how often they are being called, their response times, and their error rates.
Our dashboard allows you to see how many function calls your functions are getting, to which endpoints, their HTTP method, and what response statuses they are returning:
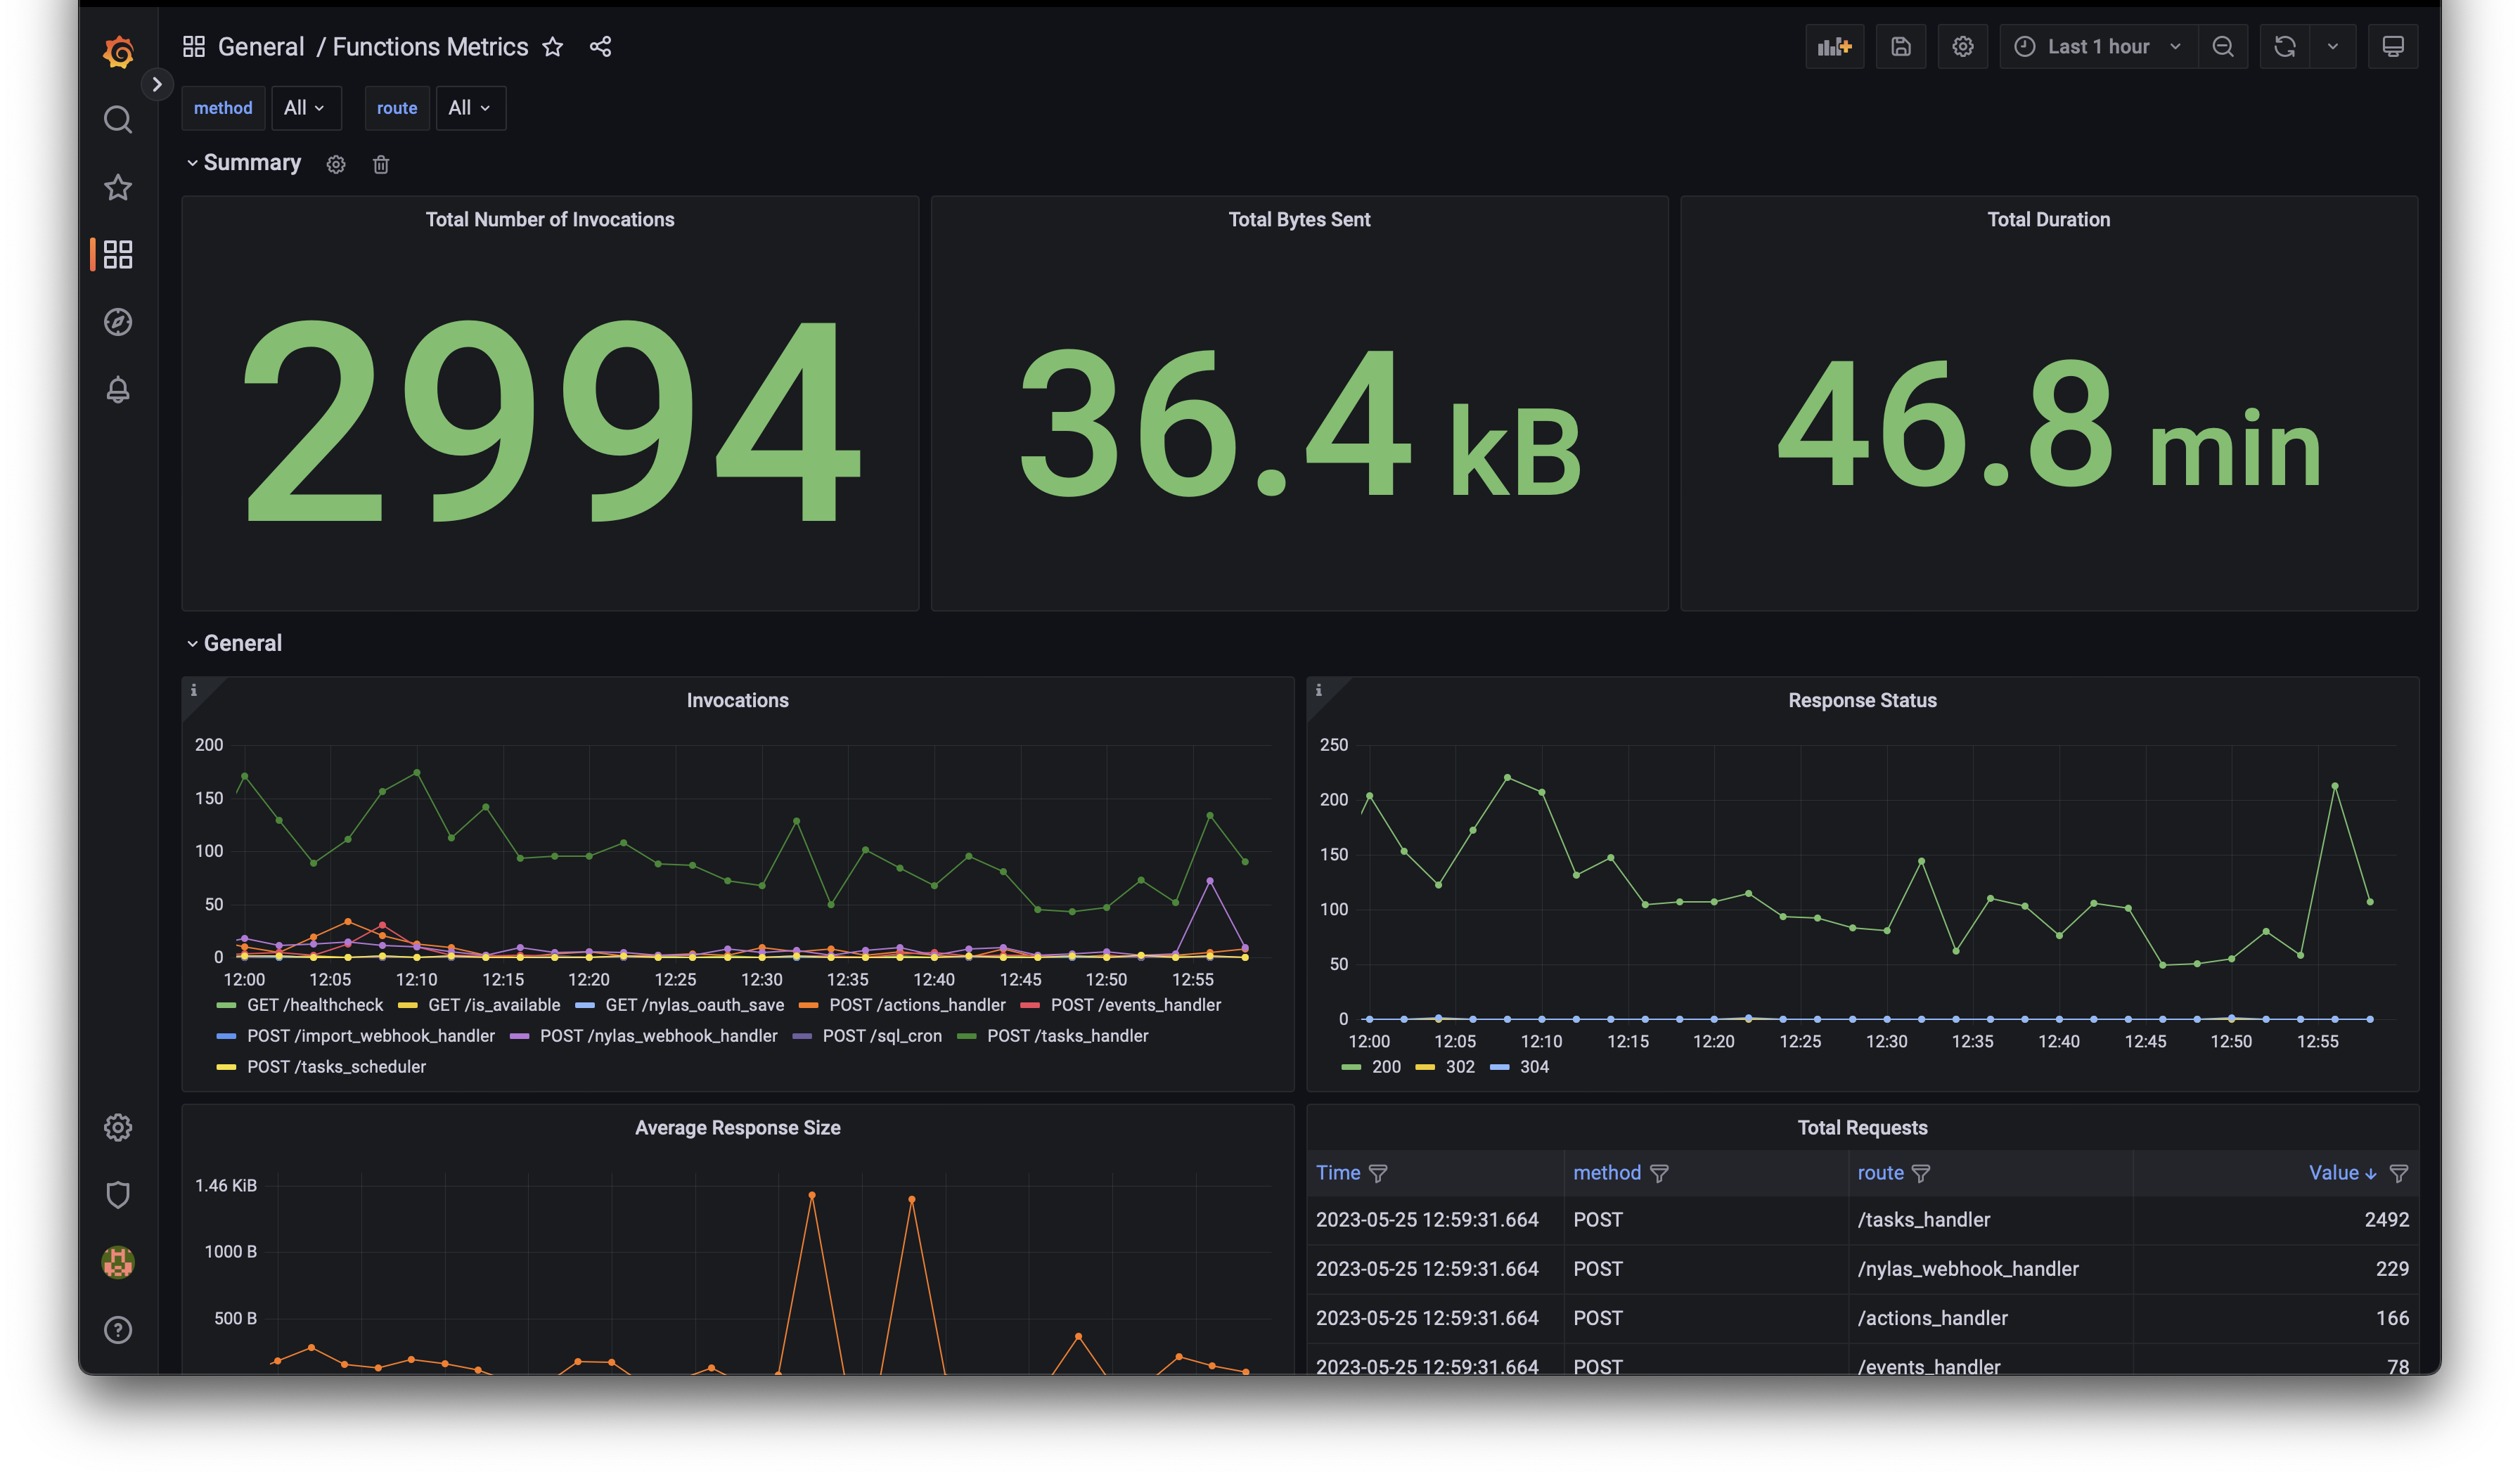 Functions summary
In addition, it provides you with useful information about response times, allowing you to identify bottlenecks in your application and outliers:
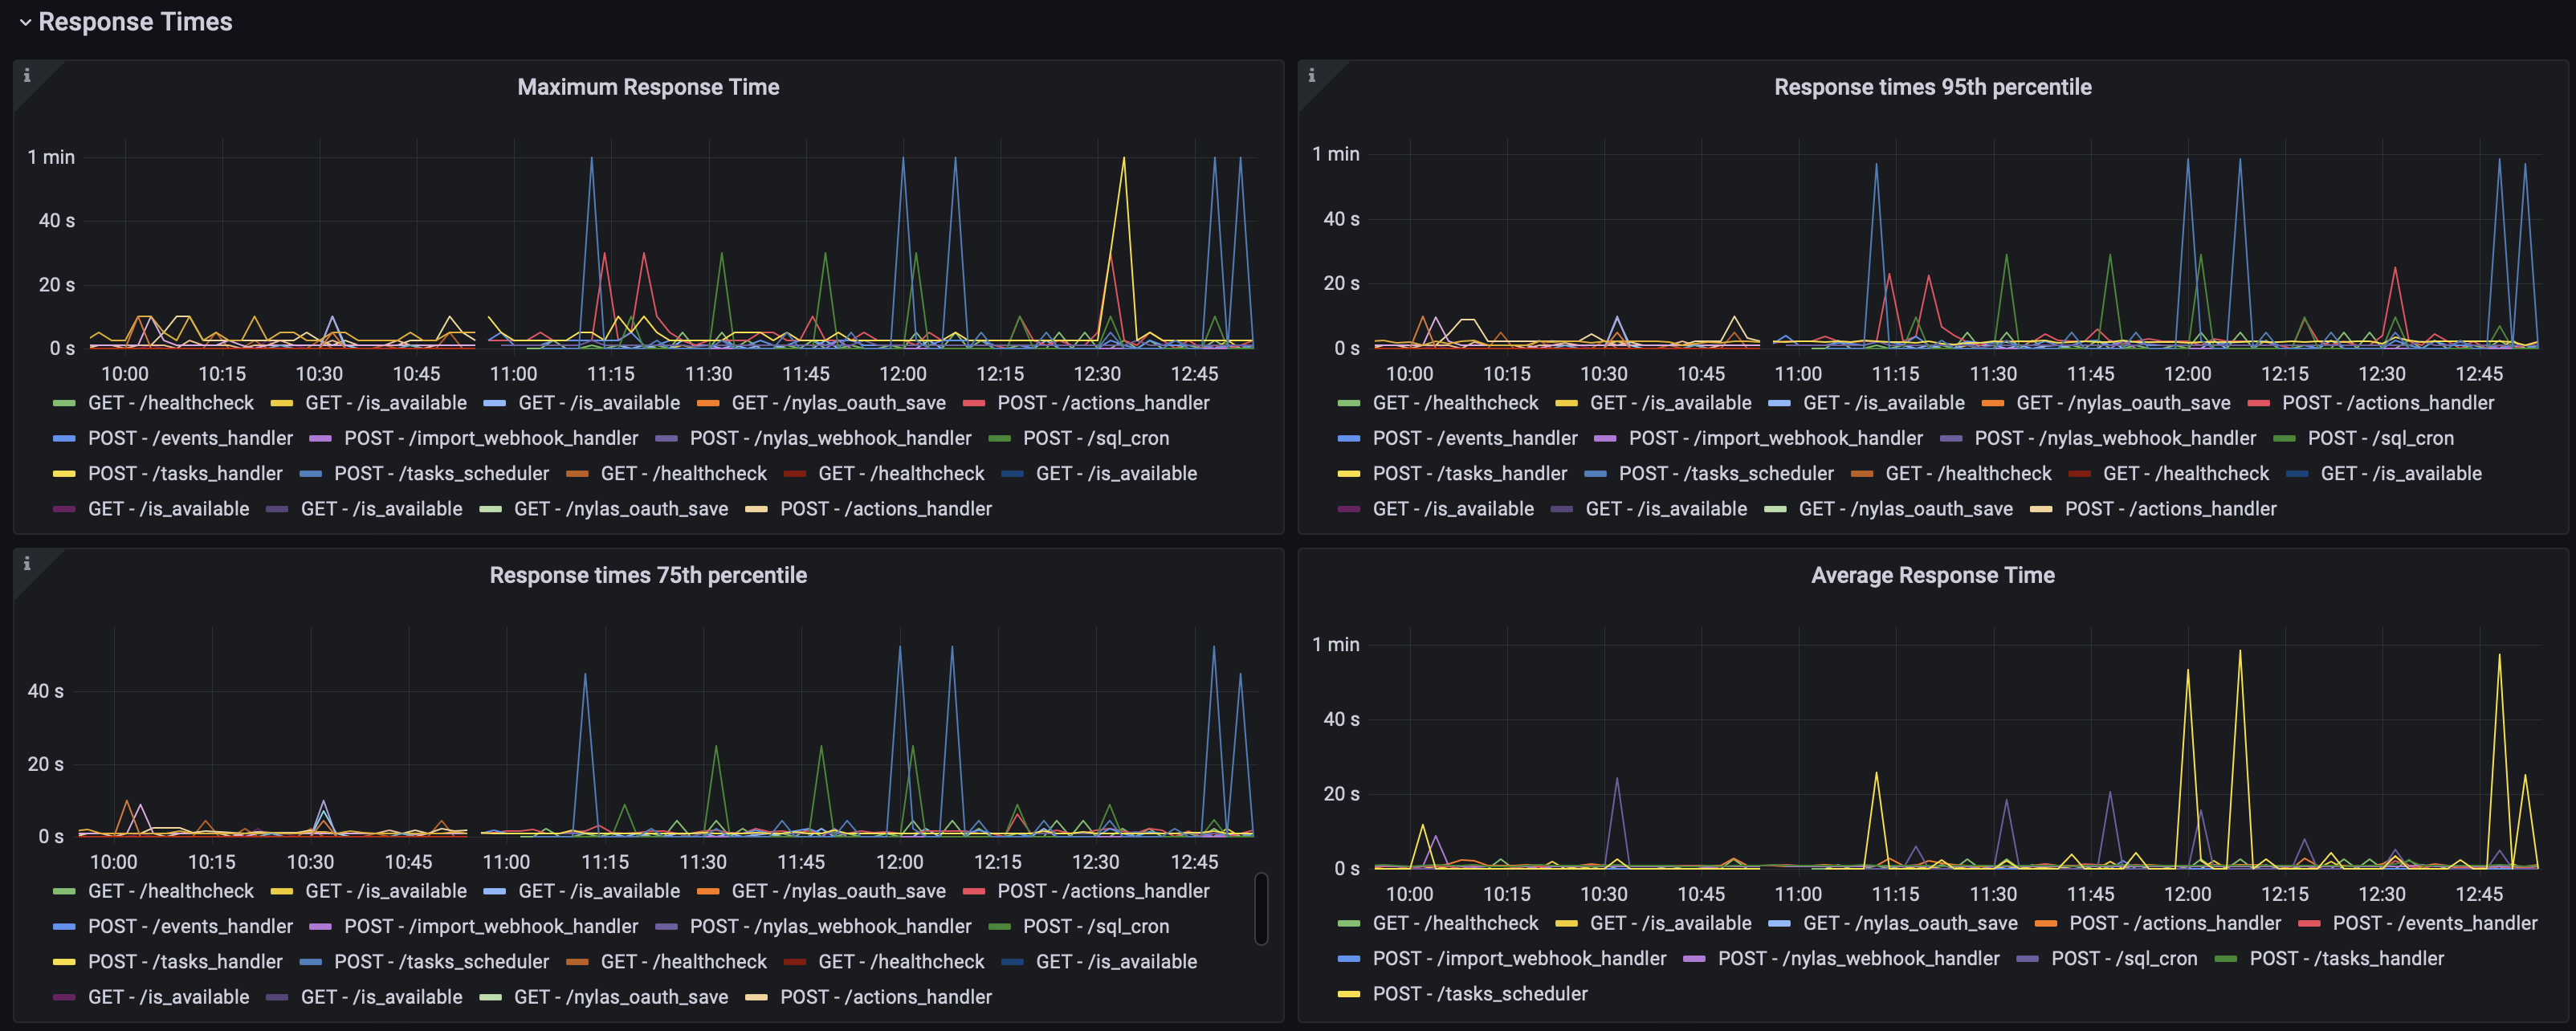 Response Times
And last but not least, you can identify problems in your application by looking at the error rates and their response status:
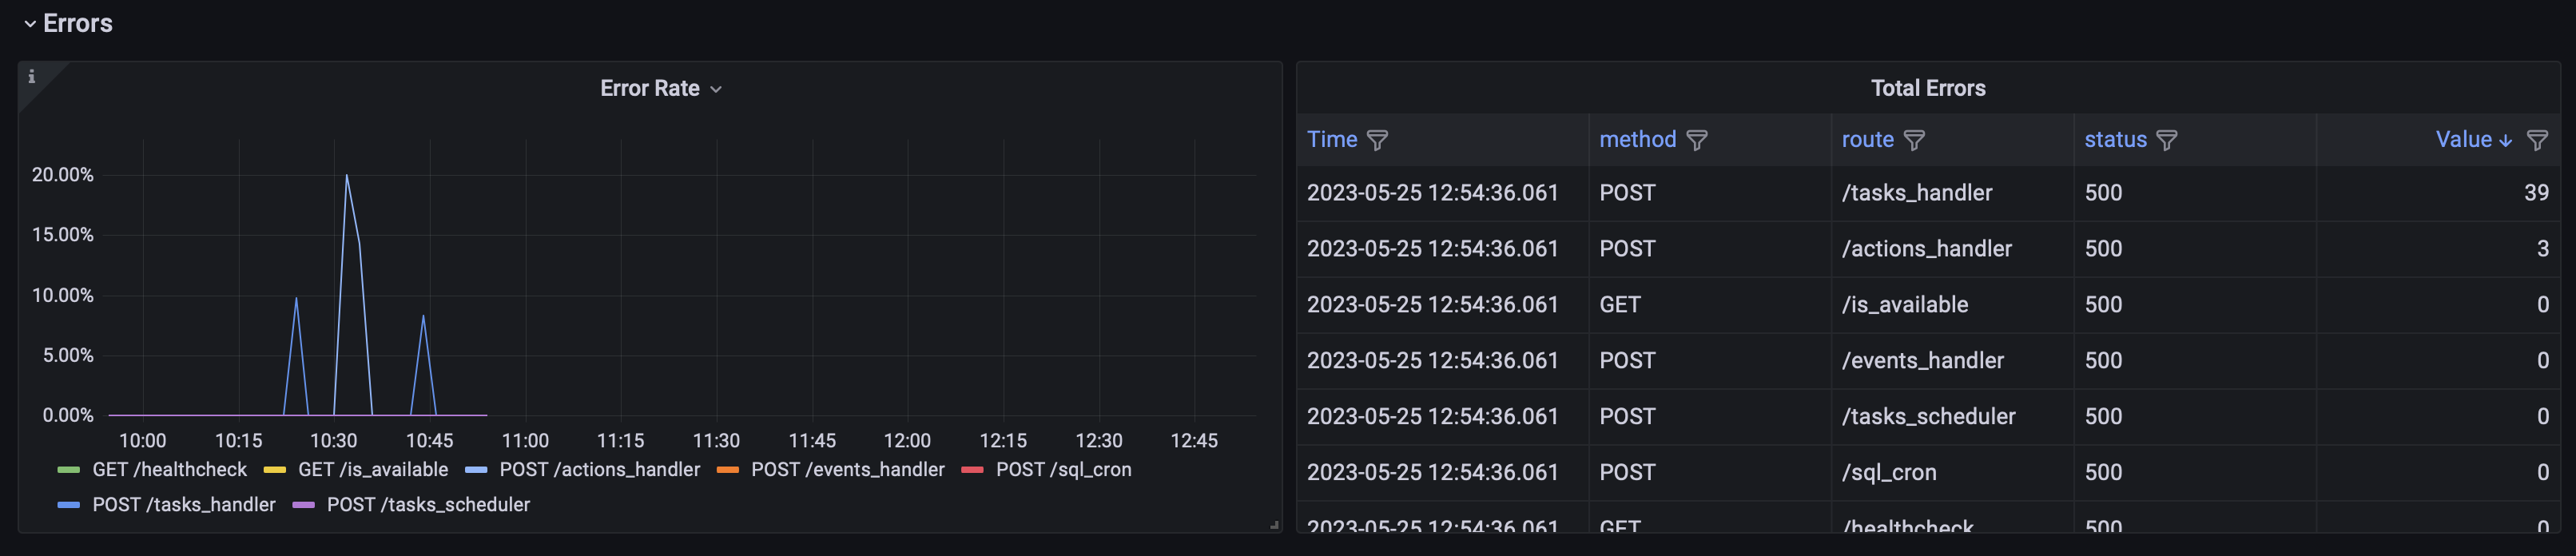 Errors
We hope you find this dashboard useful! If you have any questions or feedback don't hesitate to let us know.
Share this post