Comprehensive Monitoring with Nhost Metrics, Powered by Grafana
10 May 2023
We're happy to open up the Beta for Nhost Metrics, our latest feature designed to help you better understand and optimize your projects. Starting on the Pro plan, you can now unlock the power of Grafana — a leading open-source platform for monitoring and observability — to gain complete visibility into your Nhost projects.
Nhost Metrics
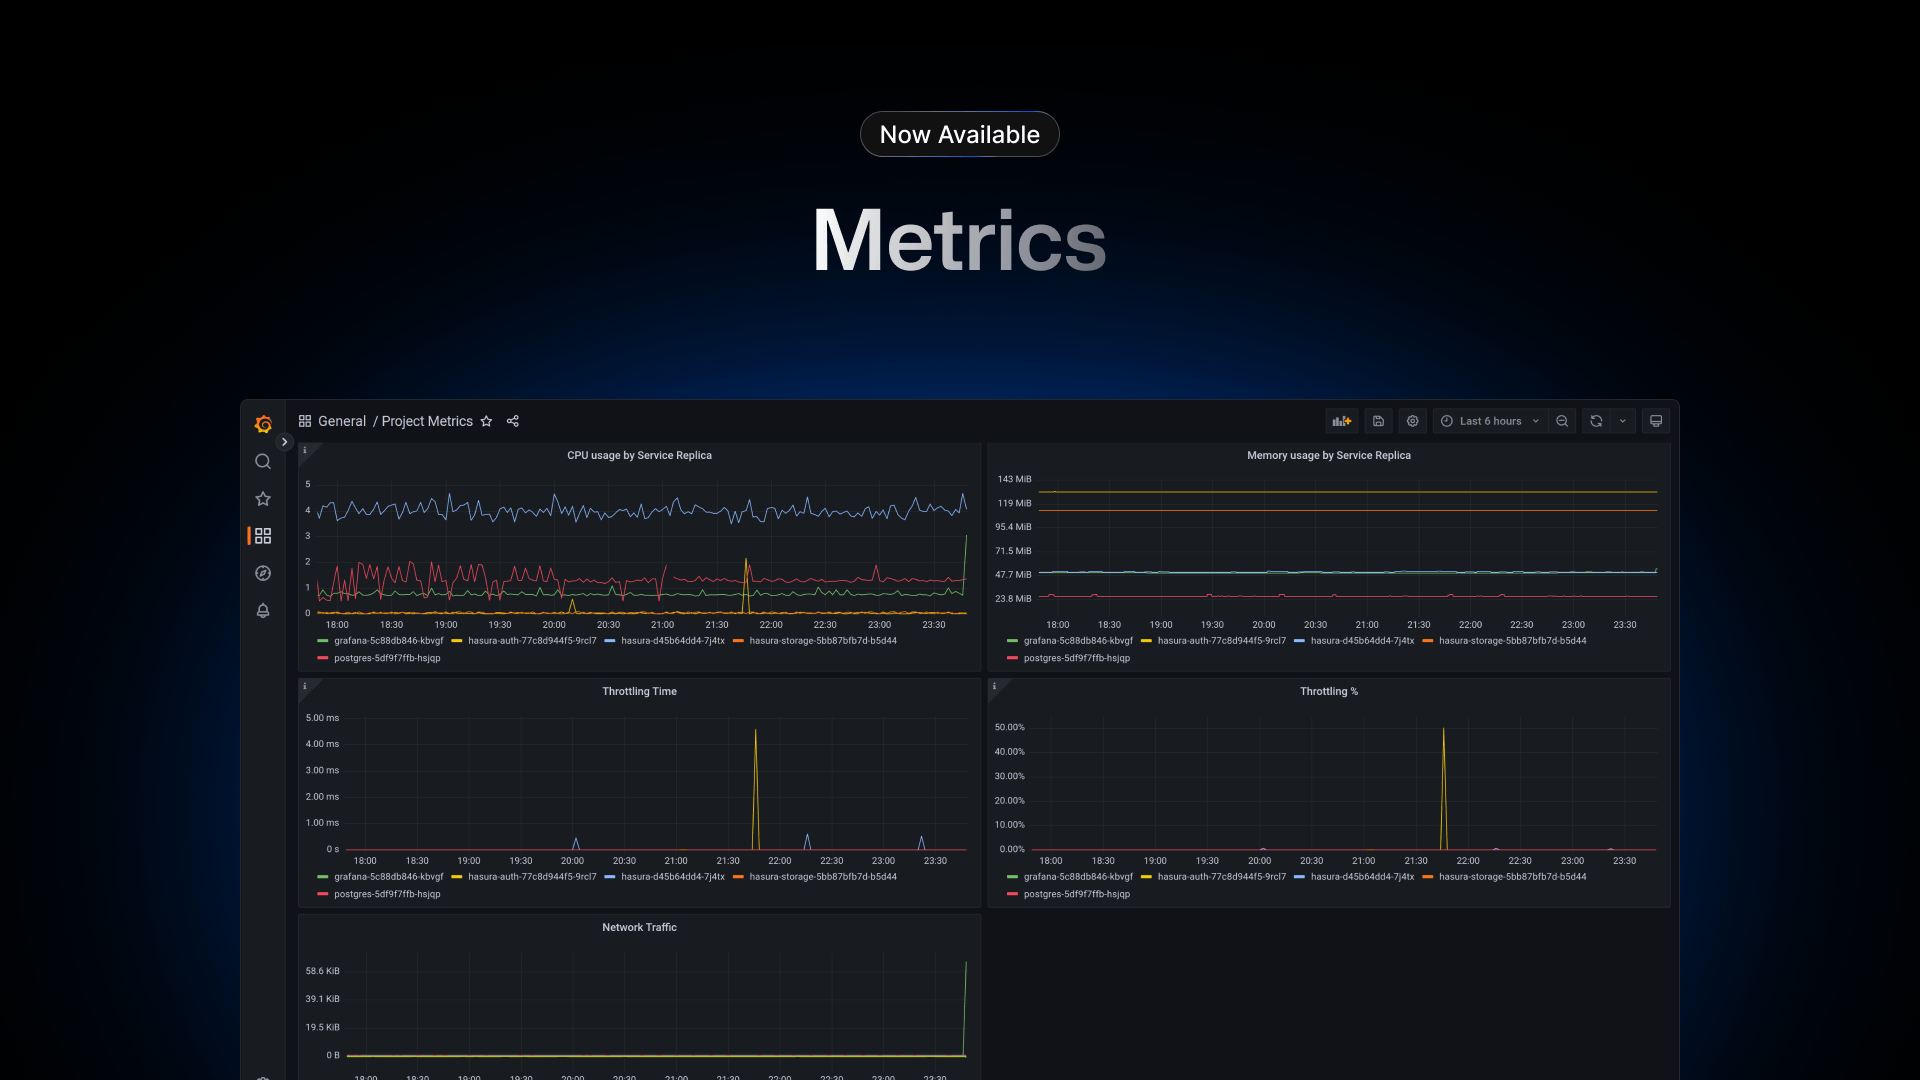
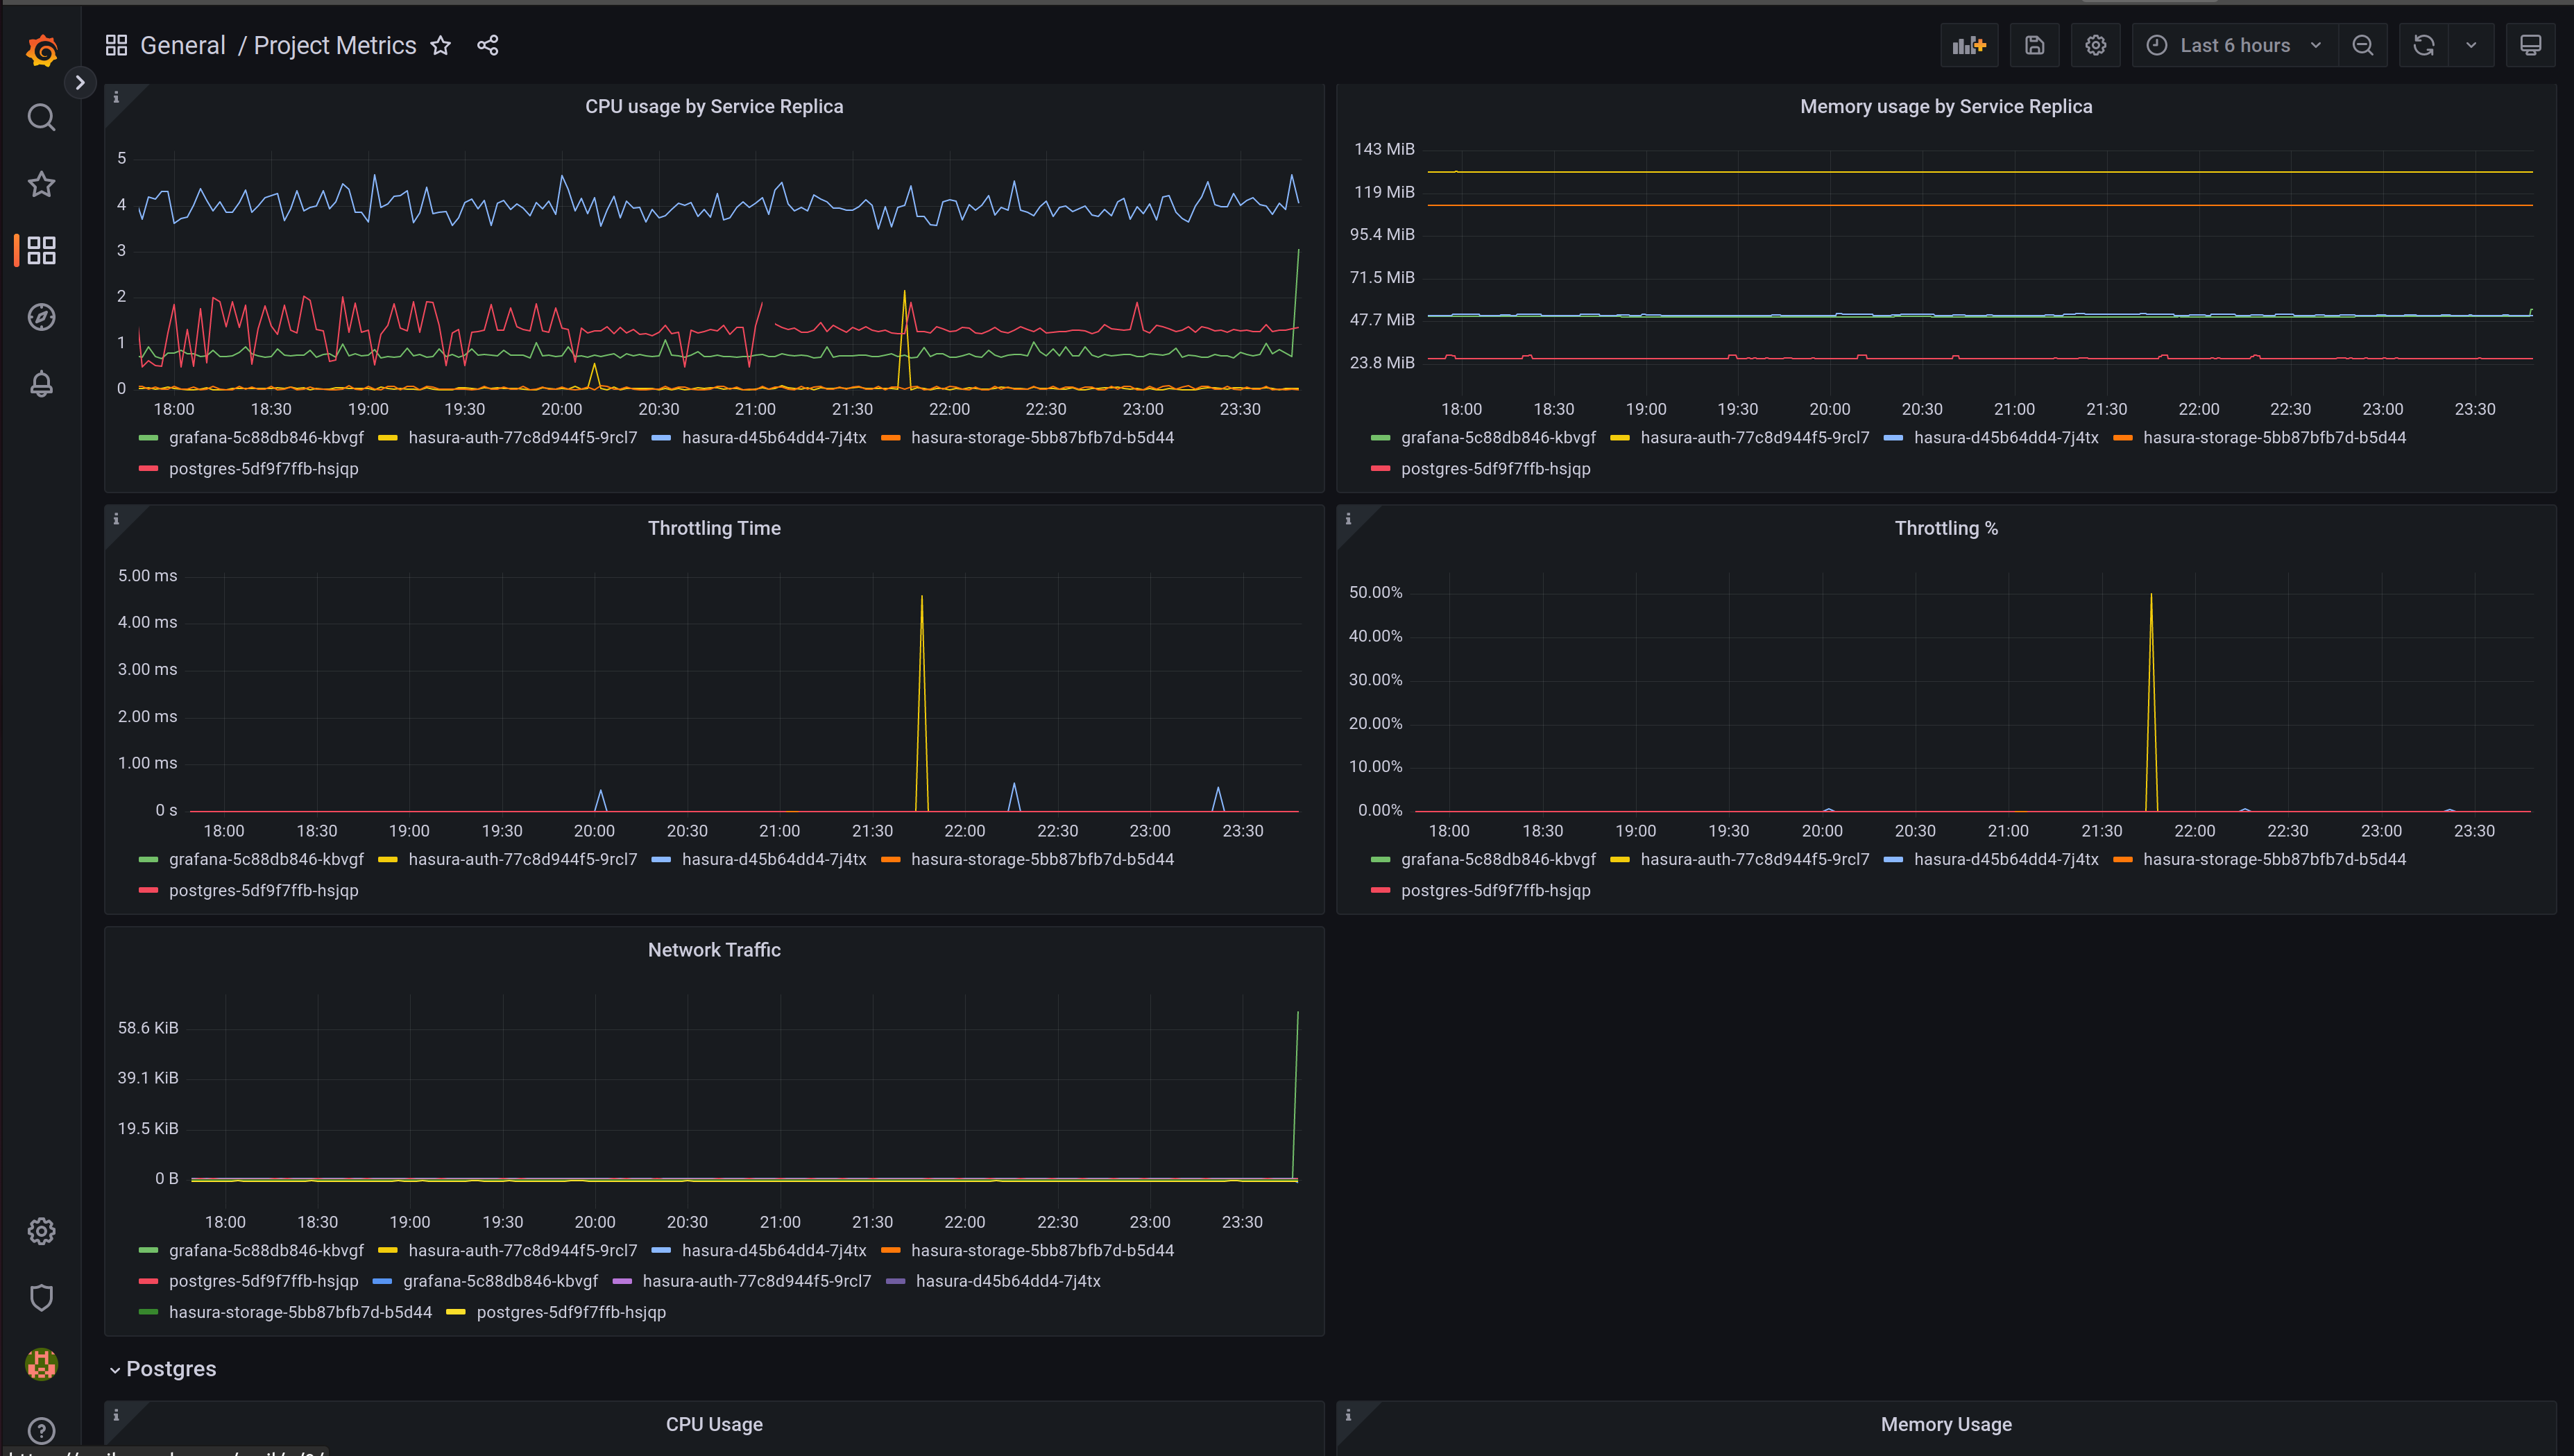
Metrics is a managed Grafana instance configured and tailored to your project. It ships with a set of default dashboards consisting of the following information:
- vCPU/memory usage by Service replica for all services
- Throttling time / percentage
- Postgres volume usage
- Networking
This beta release focuses on infrastructure metrics, but we will work on additional categories like application metrics (e.g. request rate, response time) and database metrics (e.g. query rate, slow queries). In the near future, we plan to centralize logs using Loki and integrate alerts directly into your Grafana dashboard, offering a powerful one-stop solution for metrics, logs, and alerts.
 Grafana Dashboard
Why Grafana?
While we could have built our own metrics dashboard, we believe that Grafana's advanced features makes it the best option for delivering a top-notch experience. We have been using Grafana to monitor all our internal systems, since the beginnings of time, and we believe it is the best tool for the job.
Getting Started
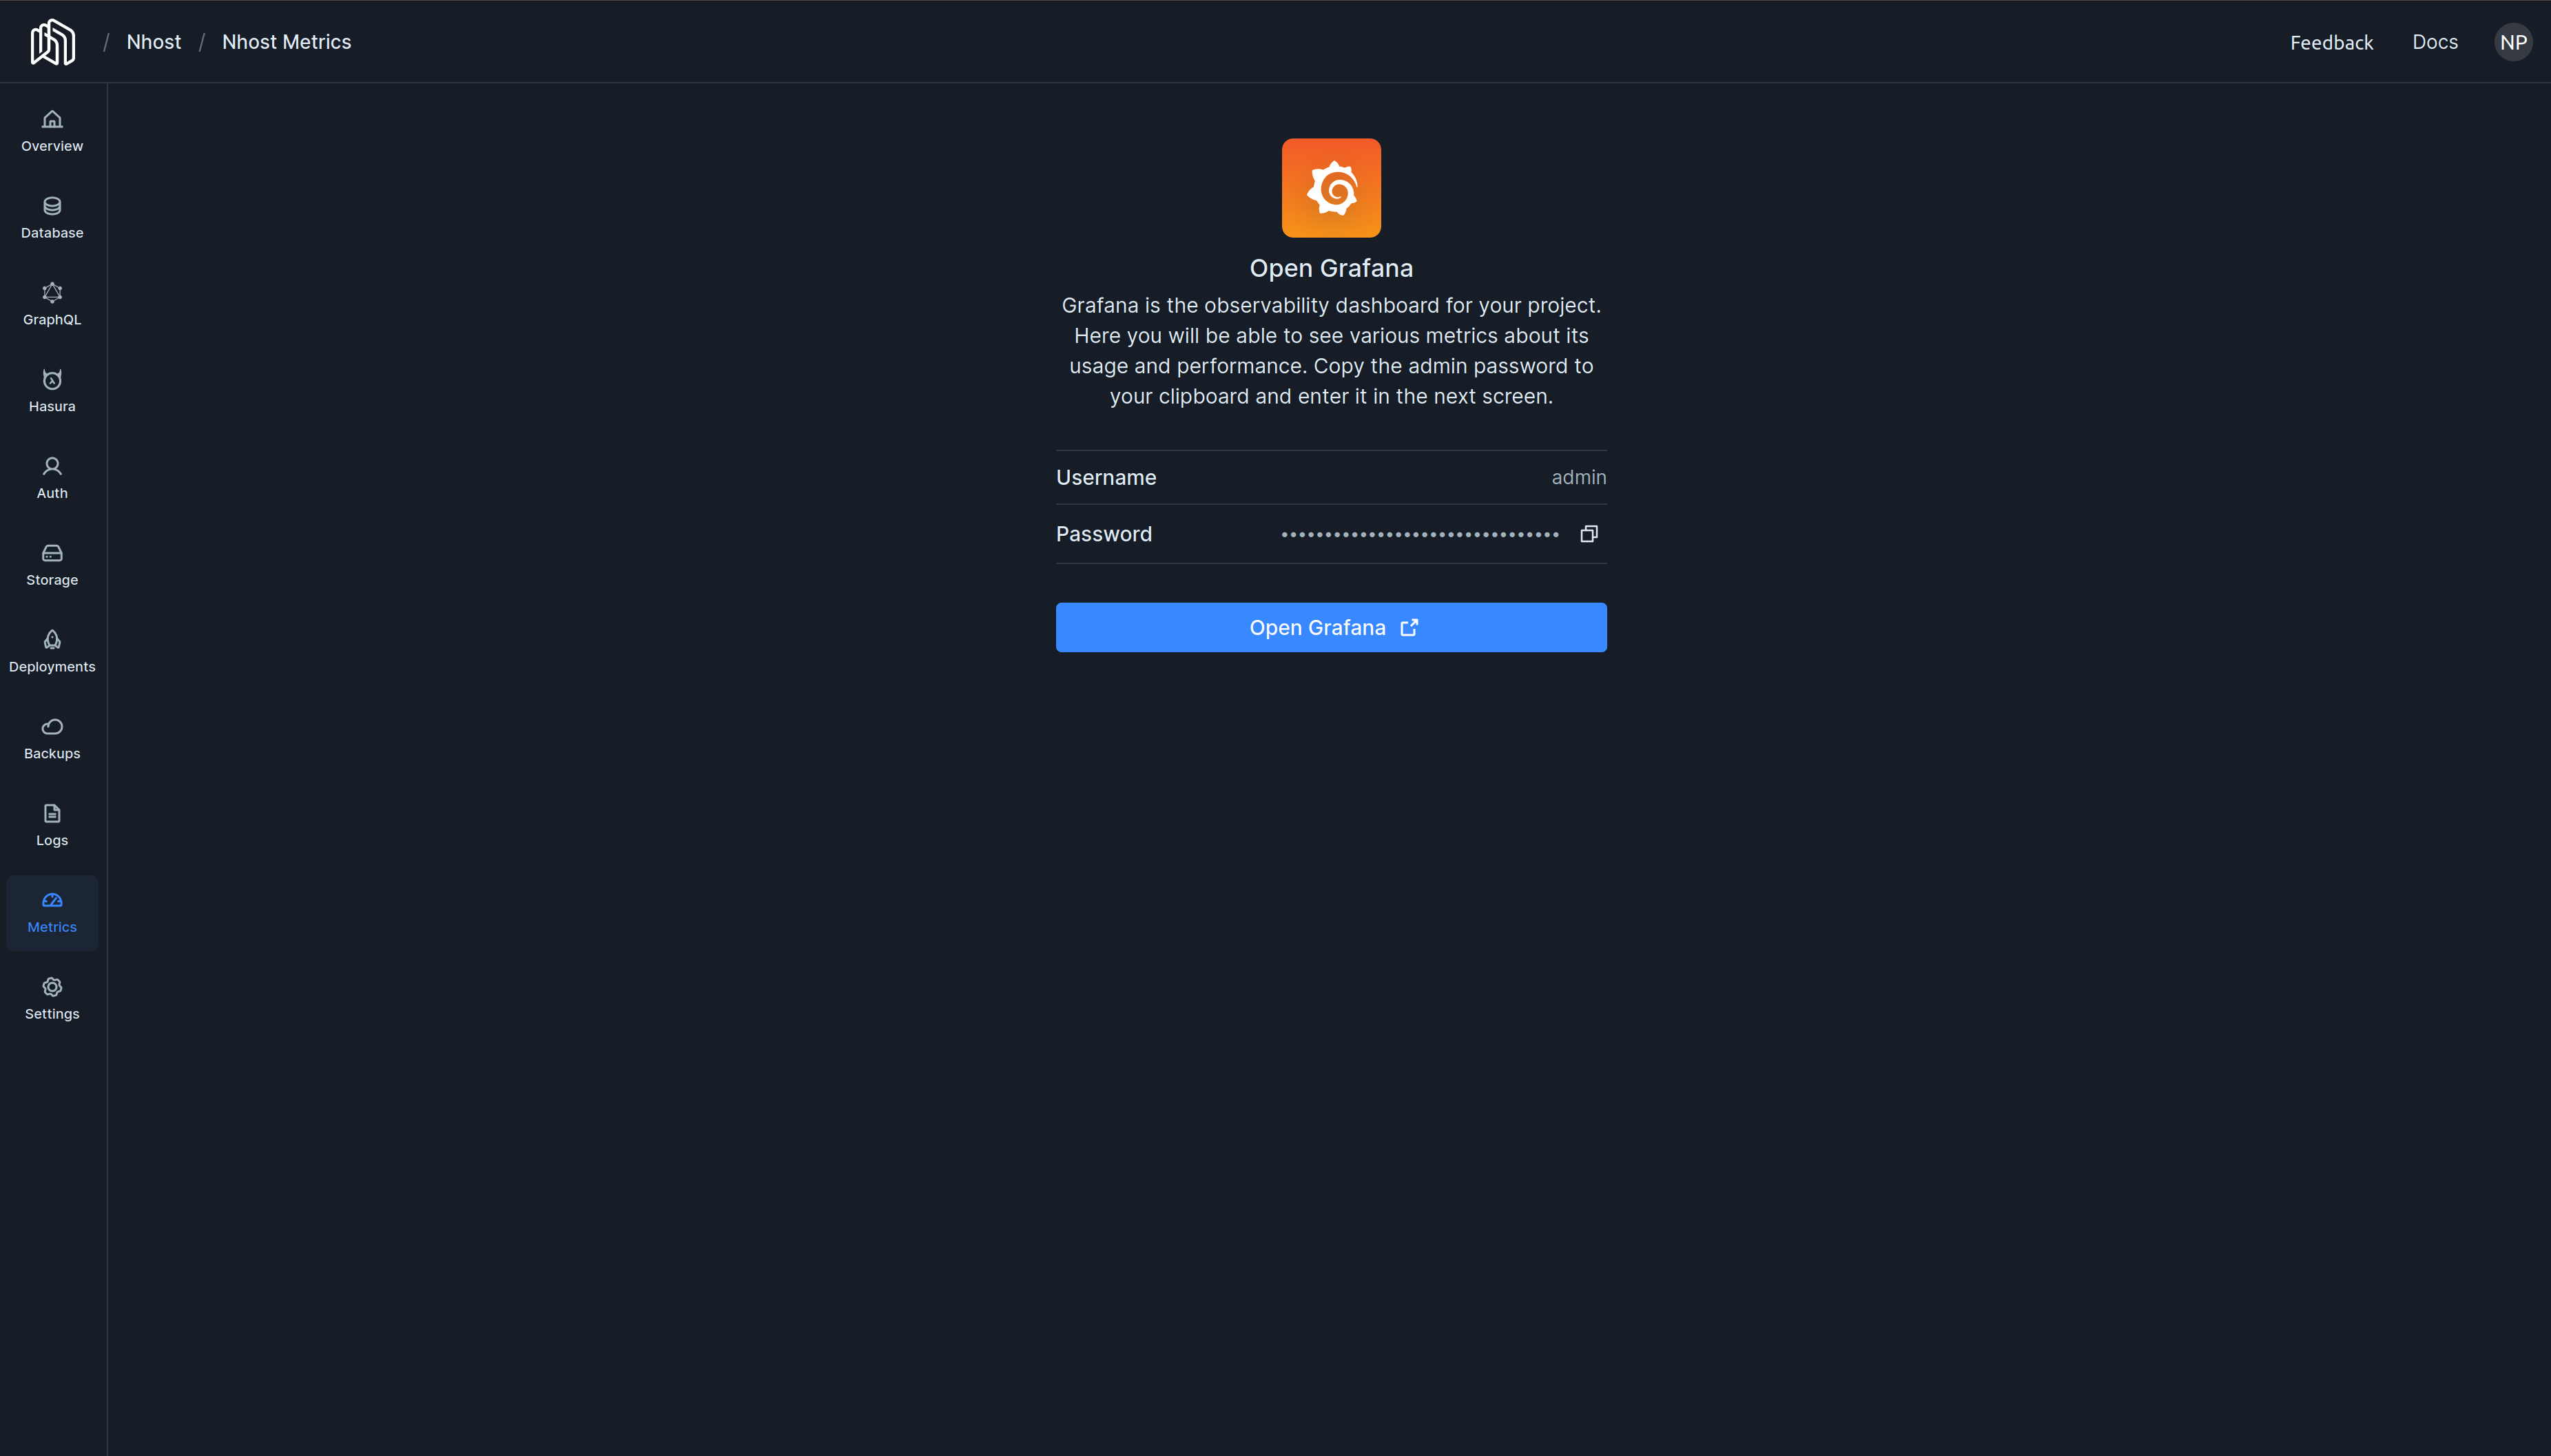
You can find the link to your project's Grafana instance by navigating to the "Metrics" option in the Nhost Dashboard.
 Nhost Metrics
Wrapping Up
Combined with our recent releases on Dedicated Compute and Service Replicas, Metrics is the next step in our mission to provide you with a complete toolkit for managing and optimizing your Nhost projects.