Nhost Logs
30 September 2022


Welcome back, today is the last day of our first-ever Launch Week! We’re extremely excited to release another highly requested feature that will make your lives, and ours, much easier. Today we are releasing Nhost Logs to give you superpowers!
Background
Logs are a fundamental part of any development and debugging workflow. Without them, developers are simply doing guesswork and flying blind.
By having logs as a first-class feature and introducing them in our dashboard, we hope to help you improve your debugging workflow when something is misbehaving. This is the first step in the direction of creating a powerful yet easy-to-use debugging and observability platform that will allow you to fix regression bugs or query performance issues as early as possible.
Logs are a fundamental part of any development and debugging workflow. Without them, developers are simply doing guesswork and flying blind.
By having logs as a first-class feature and introducing them in our dashboard, we hope to help you improve your debugging workflow when something is misbehaving. This is the first step in the direction of creating a powerful yet easy-to-use debugging and observability platform that will allow you to fix regression bugs or query performance issues as early as possible. Your users will be grateful.
Why now?
We are still a small team working on a complex product while giving support to many of our users. It might surprise some of you to know that we don’t have a dedicated support team yet and that all support is still done by our engineers and founders.
Having production logs available for all your services will not only give you superpowers, but it will also offload some of that burden from our own shoulders. You will be able to debug issues much faster and on your own without having to wait for us to be available.
Logs
In the new logs explorer, you will find the usual controls one would expect in a logging platform and that will allow you to do things such as:
- Fetch logs for a given time frame.
- Subscribe to live logs
- Filter by service
- Use one of the available presets for commonly used time frames.
Logs are available for all components that make up a project:
- Postgres
- Hasura
- Auth
- Storage
Logs for Postgres are available only for databases already running on Kubernetes which we announced earlier this week. Read about Individual PostgreSQL Instances.
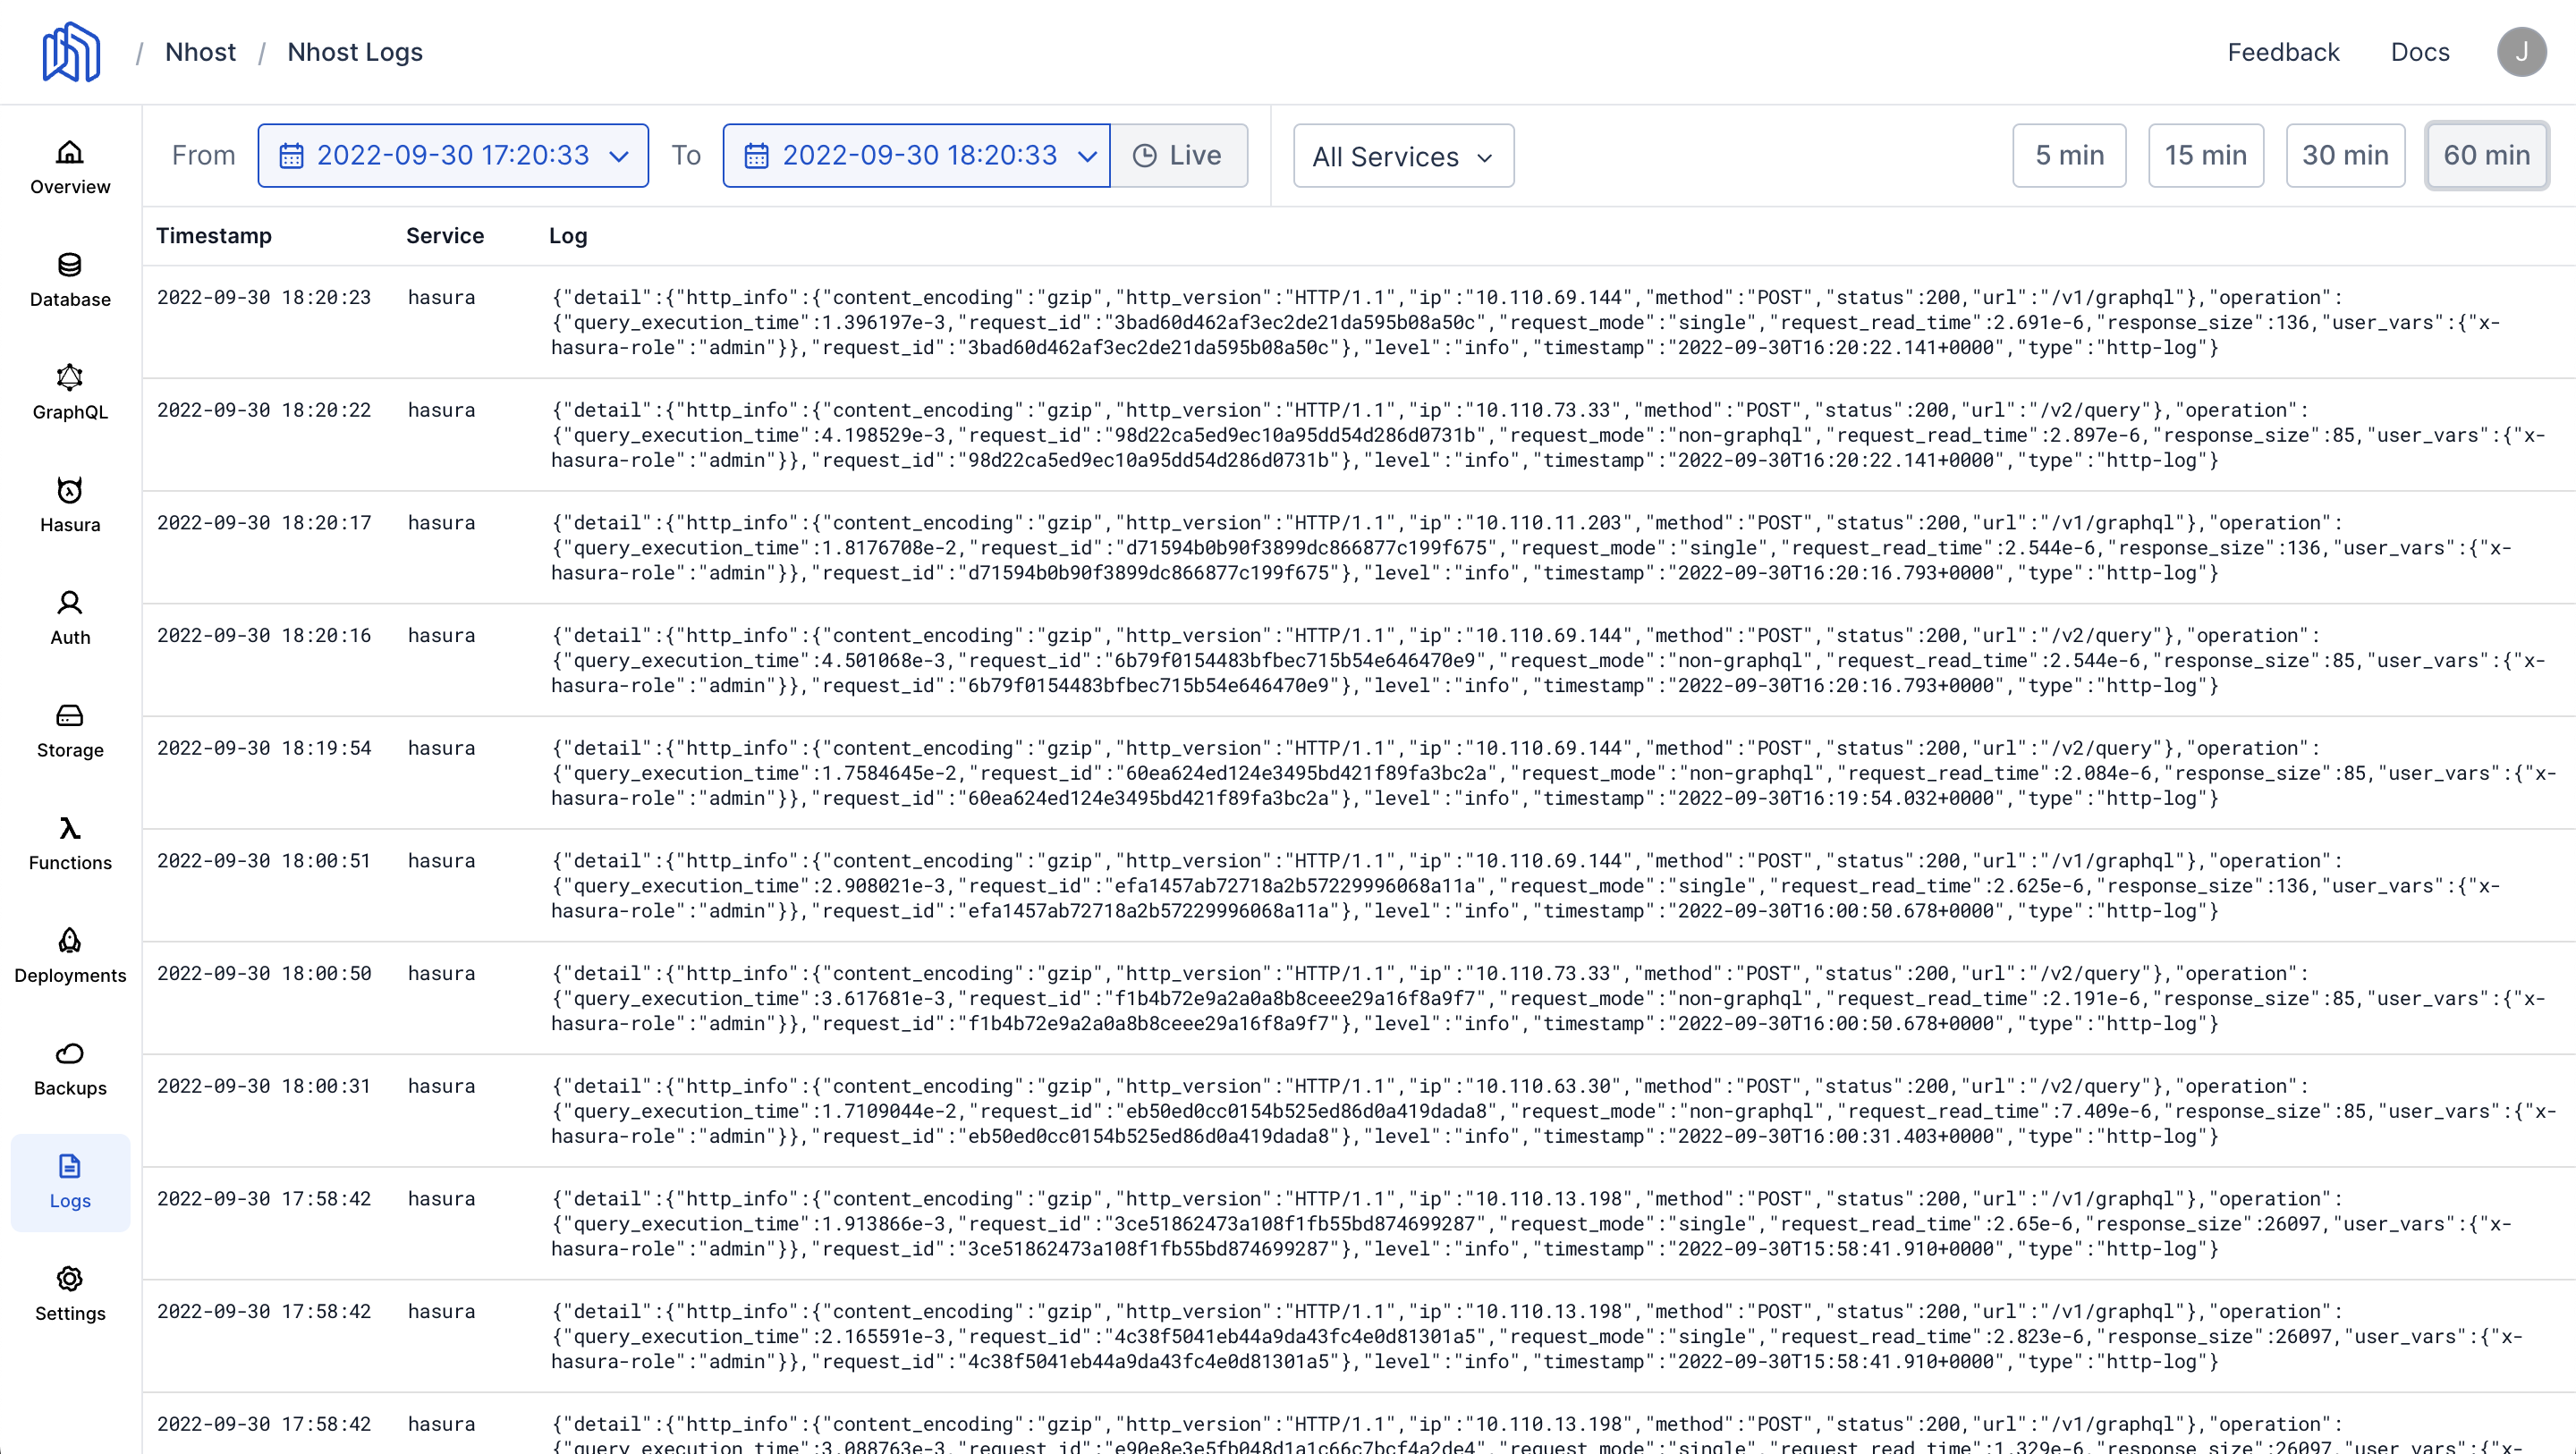 Logs Explorer
How it works
Behind every successful feature, there is a powerful backend and this is no exception. Before we can even start thinking about providing you with logs, there are three things we need to do:
- Extract your application's logs.
- Enrich them with metadata.
- Store them in a performant and queryable datastore.
These steps are often referred to as ETL (Extract, Transform, Load).
After having the logs safely stored somewhere with all the relevant metadata, we can build an API so that the frontend can query and retrieve logs.
Extracting and processing logs
We run all applications in Kubernetes, so the application's logs need to be extracted from there. Fortunately, one of the many features that make Kubernetes a great platform is its extensibility and plugin ecosystem. As we had chosen to use Grafana Loki to store our logs (more on this in the next section), it was only natural to use Promtail to extract the logs and send them to the Loki instance. In addition to integrating seamlessly with Loki, Promtail is very flexible and also enriches and filters the logs on the fly. The latter was important to us at this stage, given that we needed to do a couple of things:
- We need to filter health check logs. We have Kubernetes configured to constantly check if the application is alive and well and if it isn't, it will attempt to correct the situation. Checking the application's health means querying the
/healthzendpoint and generating some not-so-useful logs. We filter those entries out so that it is less noisy for you when browsing the logs. - We enrich logs with metadata so they can be queried efficiently later on. For instance, we add your application's ID and service name. This will ensure you can get your logs and filter them by service.
Storing logs
To store the logs, we decided to use Loki. If you are familiar with Prometheus, this is a similar service aimed at logs. We decided to go with Loki for a few reasons:
- It is open source, and we love open source!
- It is incredibly performant.
- We are big fans of other Grafana Labs’ services like Prometheus and Grafana.
- It has a much simpler architecture than other platforms like ELK - a very popular stack for aggregating and fetching logs.
Querying logs
With everything in place, the last step was to build a service to query the logs. As with most of our other backend services, we chose the following tech to build it:
- GraphQL - In case you haven't noticed already, we at Nhost are big fans of GraphQL. Getting strongly typed APIs with very well-defined semantics allows us to build better and more consistent APIs.
- Go - We use Go in the backend as it gives us the perfect balance between performance and speed of development.
- Gqlgen - Gqlgen is a library that takes a GraphQL schema and generates all the types and boilerplate to build a GraphQL server quickly. It supports other web frameworks we use like gin, custom directives, custom types, etc.
With the tech chosen, the next step was to prepare the schema so we could build the server skeleton and start implementing:
_39"""_39Require JWT granting permissions to see the logs for the given application_39"""_39directive @hasAppVisibility on ARGUMENT_DEFINITION_39_39_39scalar Timestamp_39scalar uuid_39_39type Log {_39 timestamp: Timestamp!_39 service: String!_39 log: String!_39}_39_39type Query {_39 """_39 Returns logs for a given application. If `service` is not provided all services are returned._39 If `from` and `to` are not provided, they default to an hour ago and now, respectively._39 """_39 logs(_39 appID: uuid! @hasAppVisibility(),_39 service: String,_39 from: Timestamp,_39 to: Timestamp,_39 ): [Log!]!_39}_39_39type Subscription {_39 """_39 Subscribes to logs for a given application. If `service` is not provided all services are returned._39 If `from` is not provided, it defaults to an hour ago._39 """_39 logs(_39 appID: uuid! @hasAppVisibility(),_39 service: String,_39 from: Timestamp,_39 ): [Log!]!_39}
As you can see, you can query the logs for any given project as long as you have a JWT that grants you permission to see the given project. In addition, you can filter logs by service and specify the time range you want.
We also support subscribing to logs and getting them as soon as they are generated. This is useful, for example, to monitor a live application. To implement this feature, we rely on WebSockets.
What's next
We will keep working on improving logs and give you more granular control over them. A few things we have in mind:
- Set the log level for individual services from the Nhost Console
- New controls to allow for more granular queries. It should be easy to fetch logs for errors (e.g., Bad Request, Unauthorized, etc):
- Move logs from Serverless Functions to the new logs explorer so you can fetch all logs from the same place.
More generally, an observable system provides the ability to understand any issue that arises. Conventionally, the three pillars of observability are: Logs, Metrics and Traces. Our goal is to provide them all and give you full visibility into your project runtime behaviour. Logs are just the first step.
Share this post