Nhost Autoscaler: a powerful new addition to the Nhost platform
23 May 2024


To provide you with greater flexibility in your deployment options and enable you to easily scale your application while minimizing costs, we're releasing, in private beta, a powerful new tool to our platform: the Nhost Autoscaler. This blog post aims to showcase the progress made thus far and offers a comparison of a fictional project with varying resource configurations across different load scenarios.
Workload
To benchmark our application, we've created a script using k6. The script simulates various user interactions with our application according to the following breakdown:
- One user signs up with an email and password.
- Three users refresh their token and load a page, each running 10 GraphQL queries.
This approach allows us to test and assess various components of the system. Notably, the signup process with email and password is resource-intensive due to bcrypt hashing being deliberately implemented for password security.
Goal
The objective is to observe the behavior of different configurations without aiming for maximum throughput or conducting traditional load testing on the application. In all scenarios, we maintain a fixed load to observe how stable the system remains and how fast it can do its job.
The load is created by the following process:
- A specific number of workers is designated for the task.
- Workers will run the task independently from each other and will continuously execute it for the duration of the test
- Each test will run for 5 minutes
This prolonged execution period allows for a sustained assessment of the system's performance under consistent load conditions.
It's important to note that there are no optimizations or caching mechanisms implemented during this evaluation.
Scenarios
No dedicated resources, no autoscaler, 10 workers
We start by testing the application using a vanilla Pro project. Under this configuration the project is assigned 0.5 cores to each service and, of course, there is no autoscaler involved yet.
It is important to note that with this configuration, the compute is shared. A quota mechanism is implemented to ensure that everyone uses these shared CPUs fairly. This mechanism may lead to "throttling", where a process might need to be paused for a number of milliseconds if the quota is exceeded.
We can now proceed to execute the load testing scenario, for this particular one we will be using 10 workers:
 results without resources
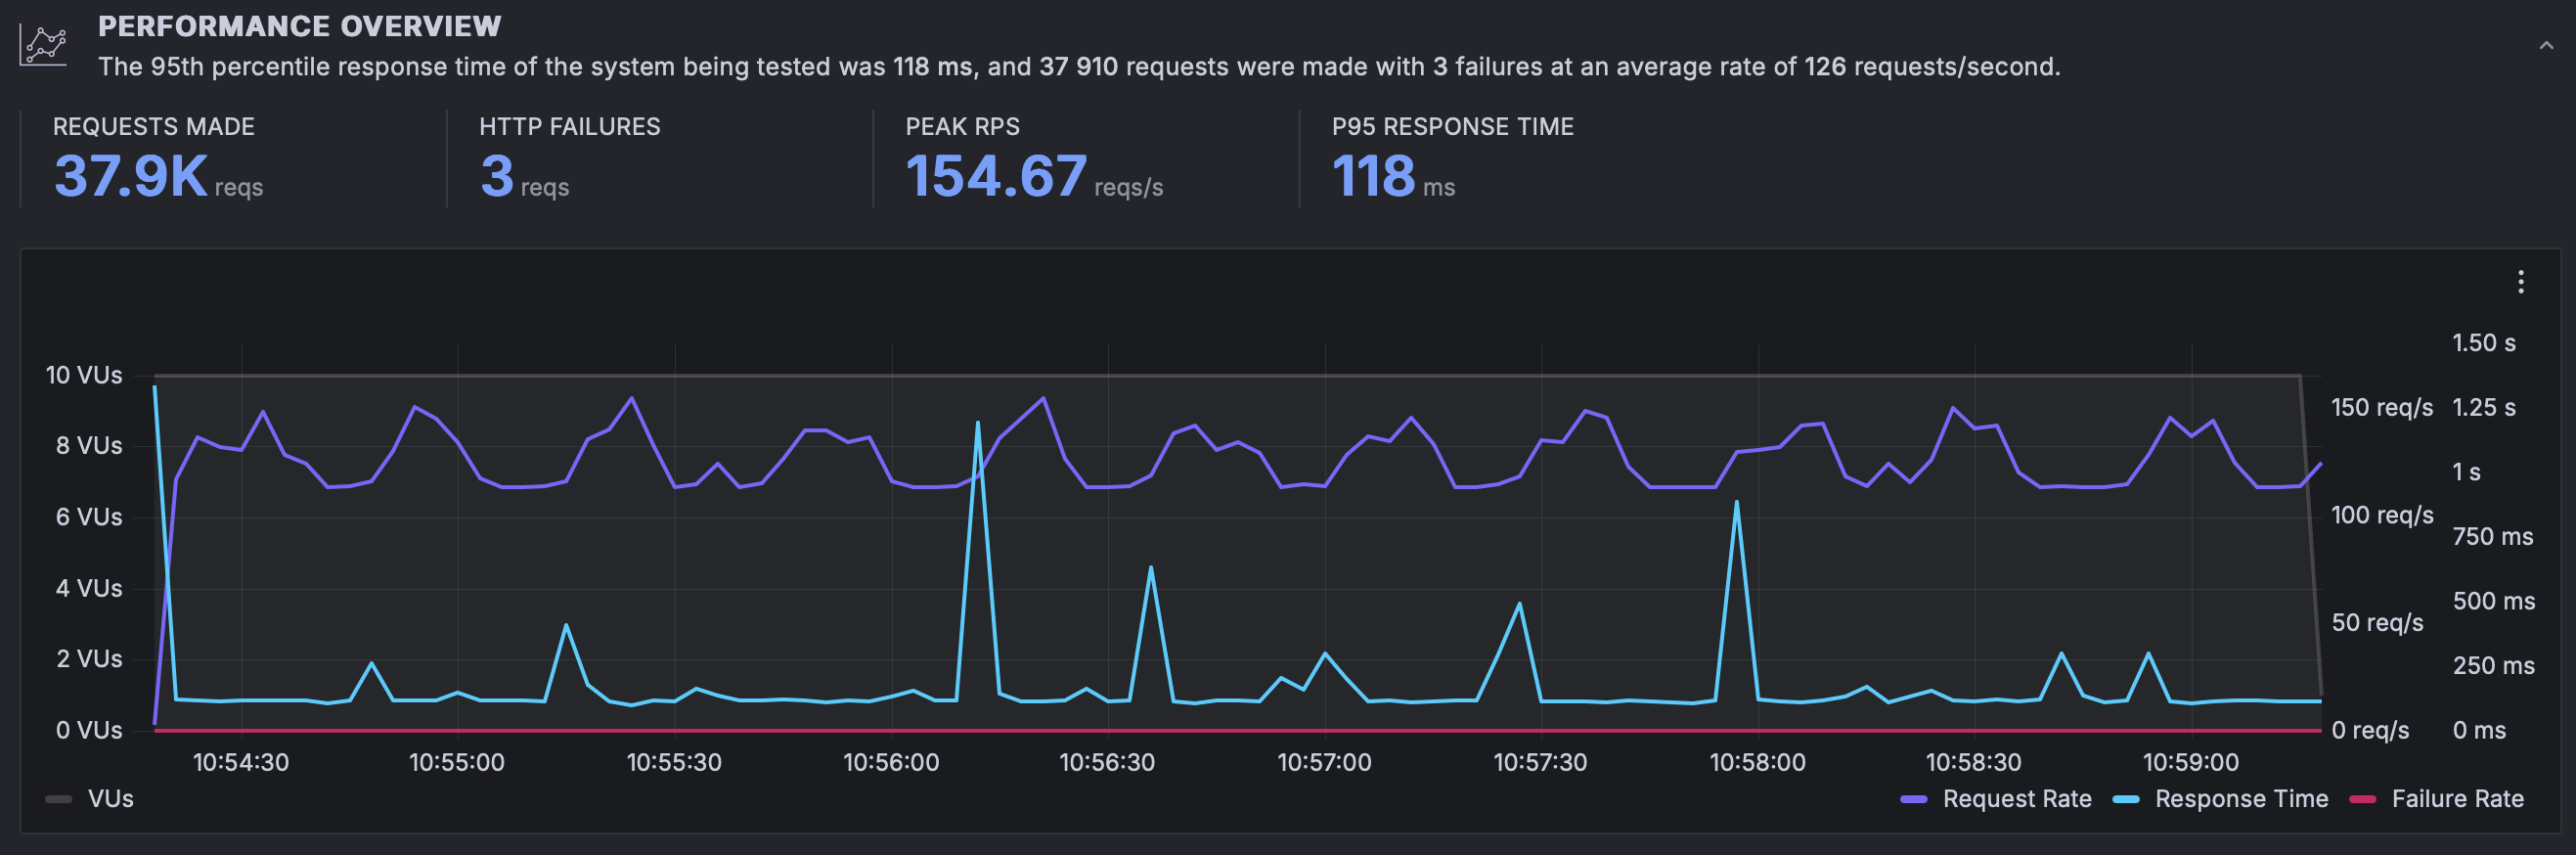
In the graph above we can observe a few things:
- During these 5 minutes a total number of 37.900 requests were completed successfully
- The system peaked at 154.67 requests per second
- The P95 response time was 118ms
The results are quite good given the amount of shared compute assigned, specially the P95 response time is quite impressive. However, something that isn't that great but it's expected are those spikes you can see in the response times. These spikes are a side-effect of the "throttling mechanism" we described before.
Dedicated resources, no autoscaler, 10 workers
Now we are going to perform exactly the same test with the same number of workers but using dedicated compute. With dedicated compute the resources you assign to each service is guaranteed and there is no throttling. To make it even more appealing, if resources are available we will allow you to exceed your assigned resources if they are available (for more information on how this work, please, refer to our docs.
We are assigning the following dedicated compute to each service:
- Postgres: 1 CPU
- Graphql: 0.5 CPUs
- Auth: 0.25 CPUs
- Storage: 0.25 CPUs
Now we can execute the tests:
 results with resources and same load
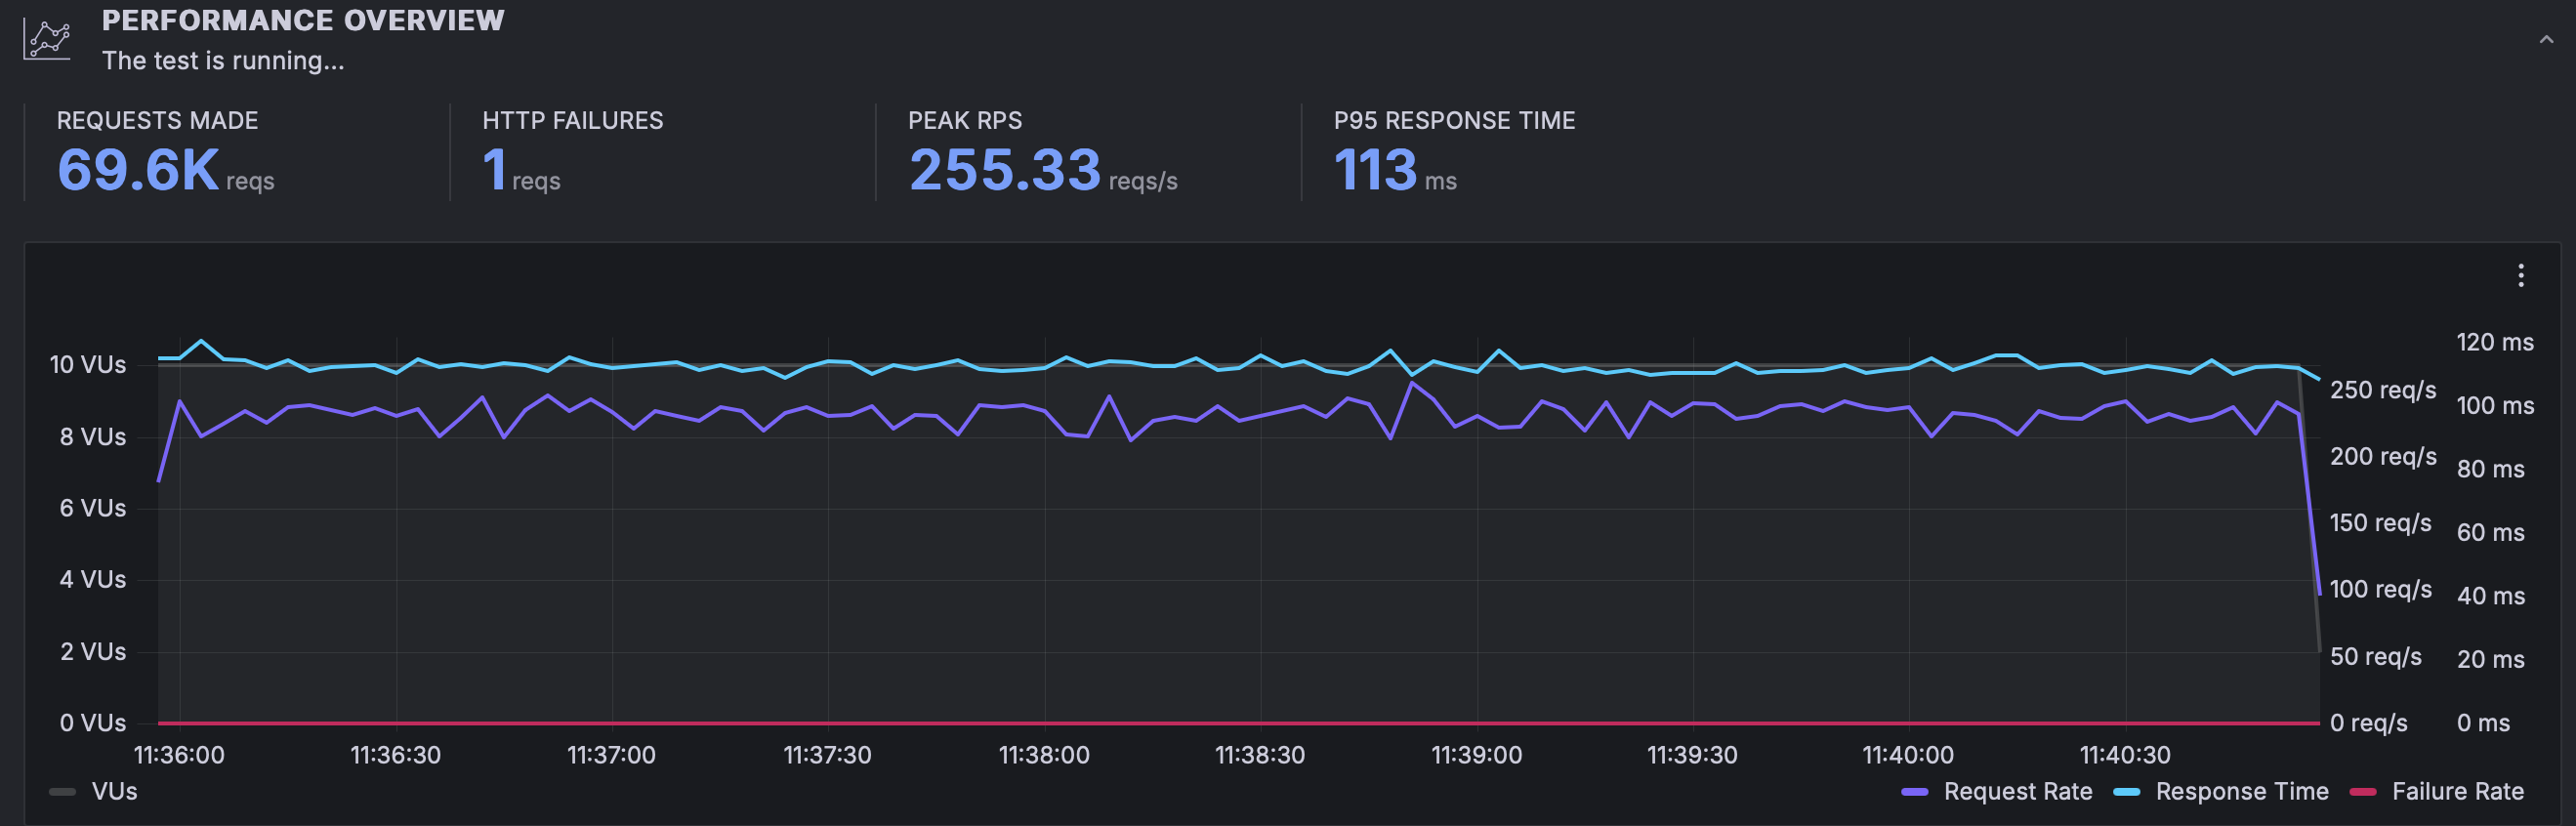
We can observe the following:
- Our total number of requests completed is almost 2x compared to before; 69.600
- Our peak RPS was also almost 2x; 255 RPS but more importantly it was stable.
- Our P95 was 113 ms, slightly lower than before
What's important in this graph is to see that performance was not only almost double but it got more predictable, with no spikes on any of the graphs.
Dedicated resources, no autoscaler, 40 workers
Now let's repeat the test but using 40 workers instead of 10:
 results with resources and 4x load
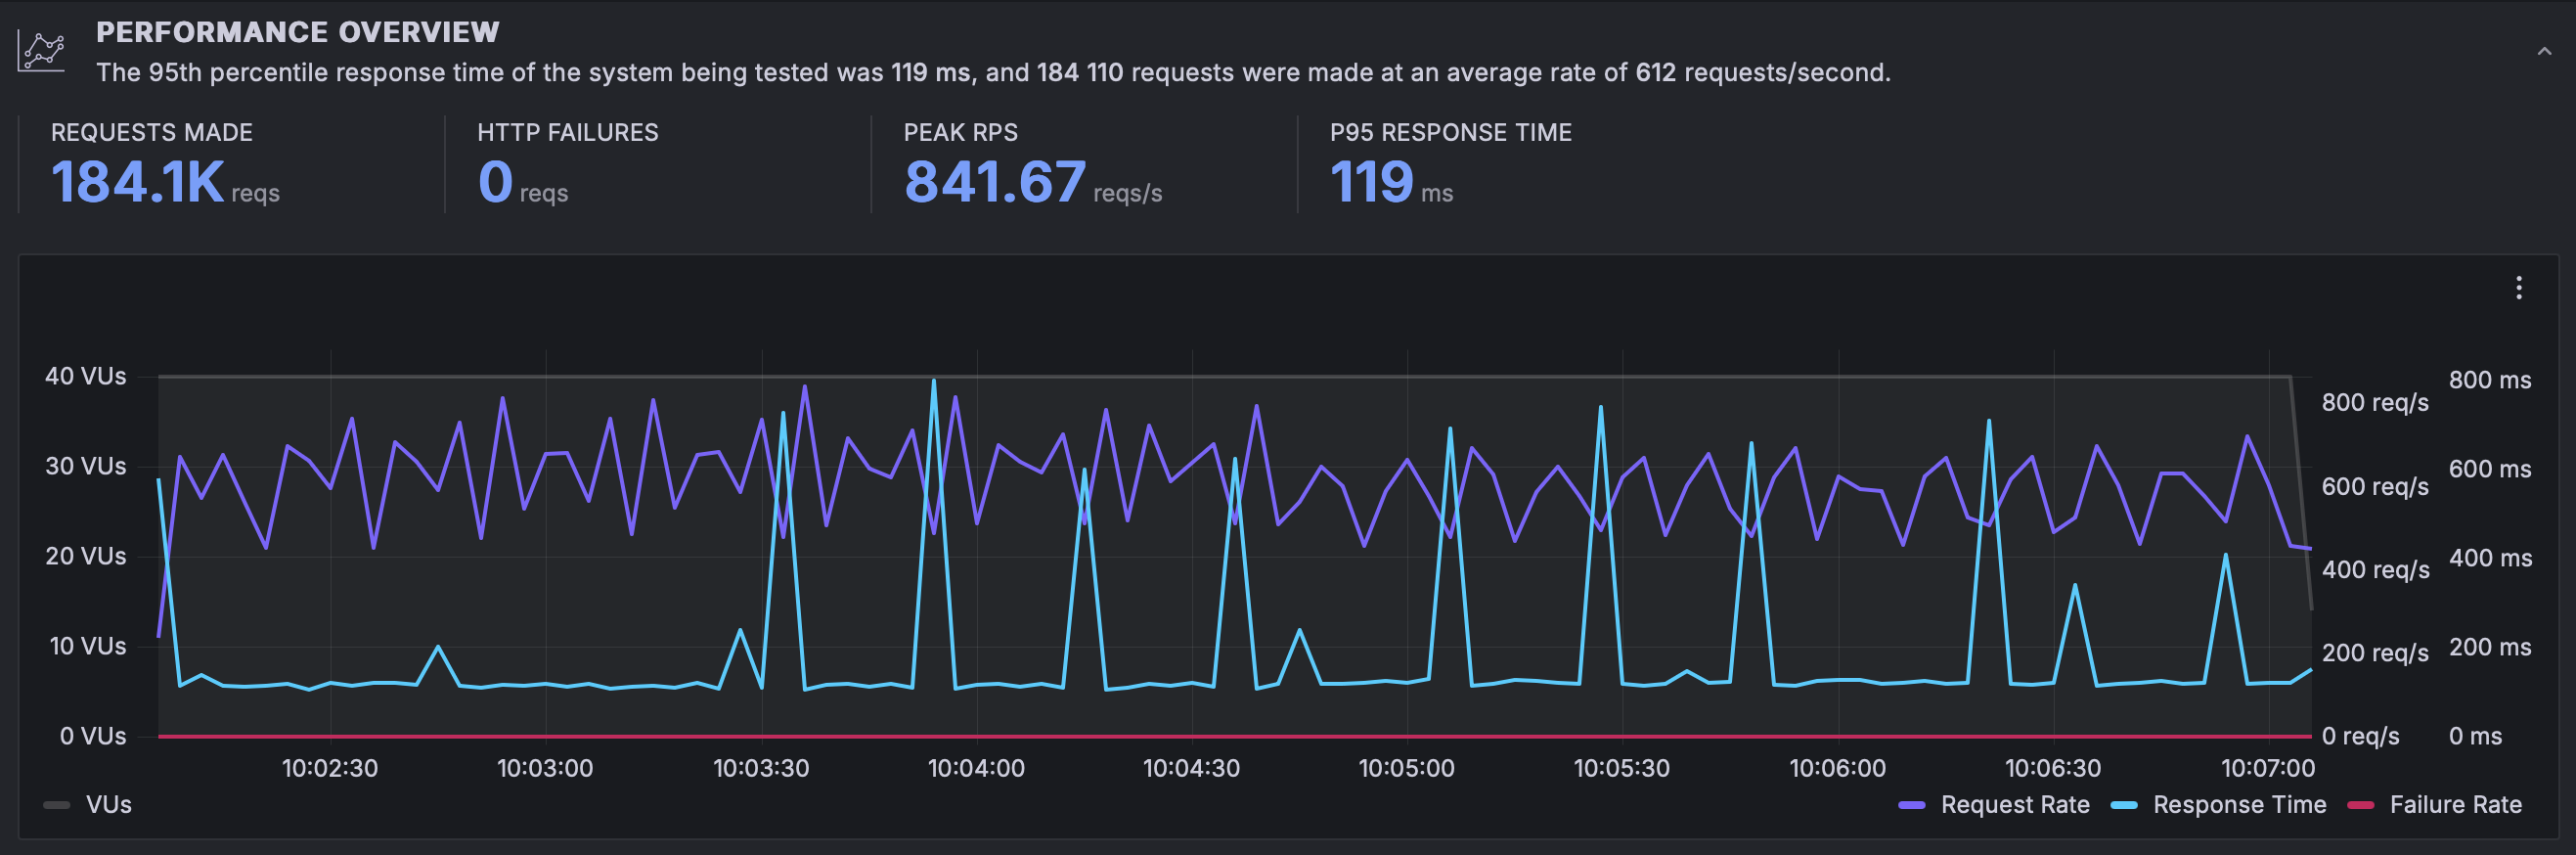
We can observe the following:
- We went from 69.6k requests in our previous load test to 184.1k. This is unsurprising as we had 4x the number of workers executing requests. This is a 2.6x increase.
- Our peak RPS went up by 3.3x, from 255 to 841
- As load increased, P95 went slightly up, to 119ms
Most notably, the spikes came back. Why? As we mentioned above, with dedicated compute we allow you to temporarily exceed your allotted resources, however, only if they are available. In the graph above you can observe when the extra resources weren't available for you in the form of those spikes.
Autoscaler, 40 workers, max 10 replicas
To make sure you don't have to rely on the availability of extra resources, nor you have to overprovision your services, you can now simply rely on the new autoscaler to automatically provision extra replicas of your services when needed and remove them when they are no longer needed.
To see it in action we are going to repeat the previous test with 40 workers but after enabling the autoscaler and instructing it to scale up to 10 replicas.
 results with resources and 4x load
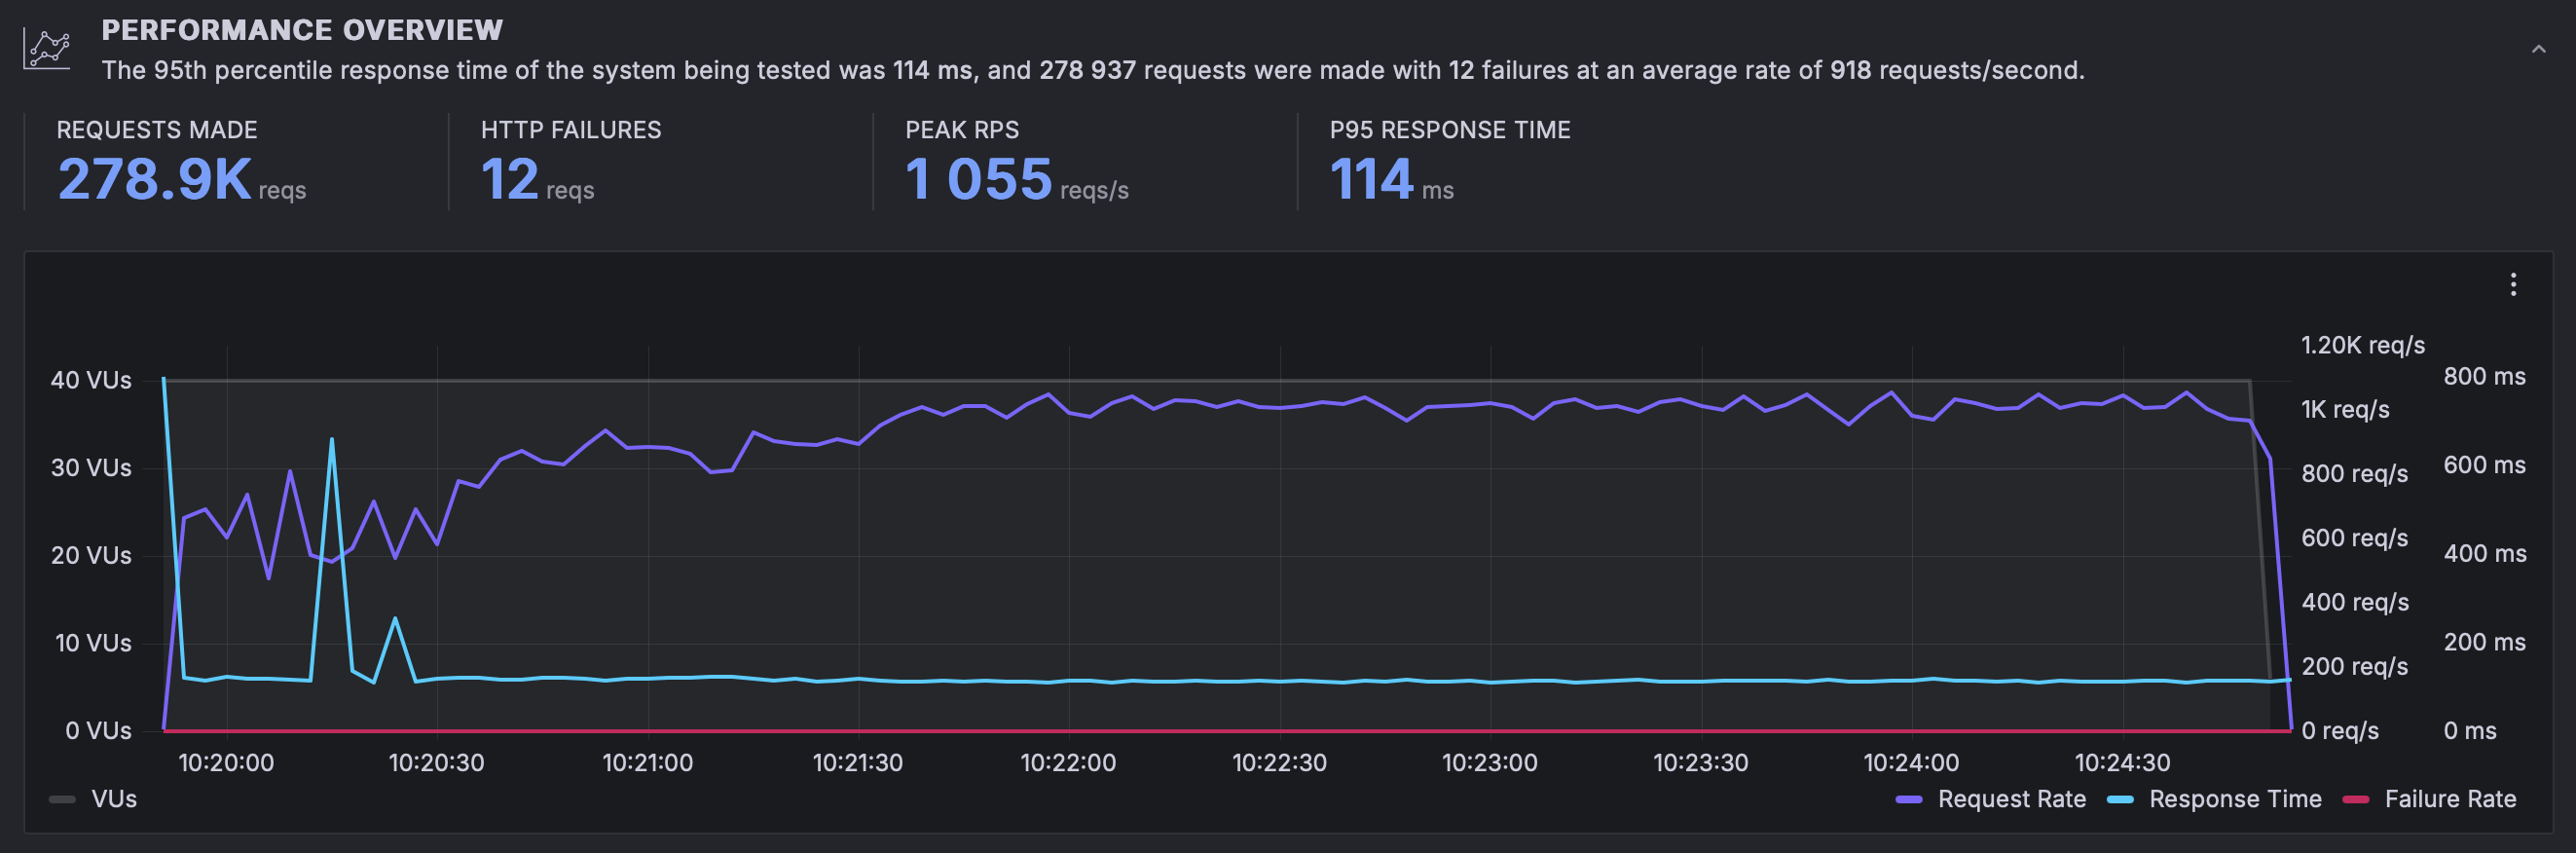
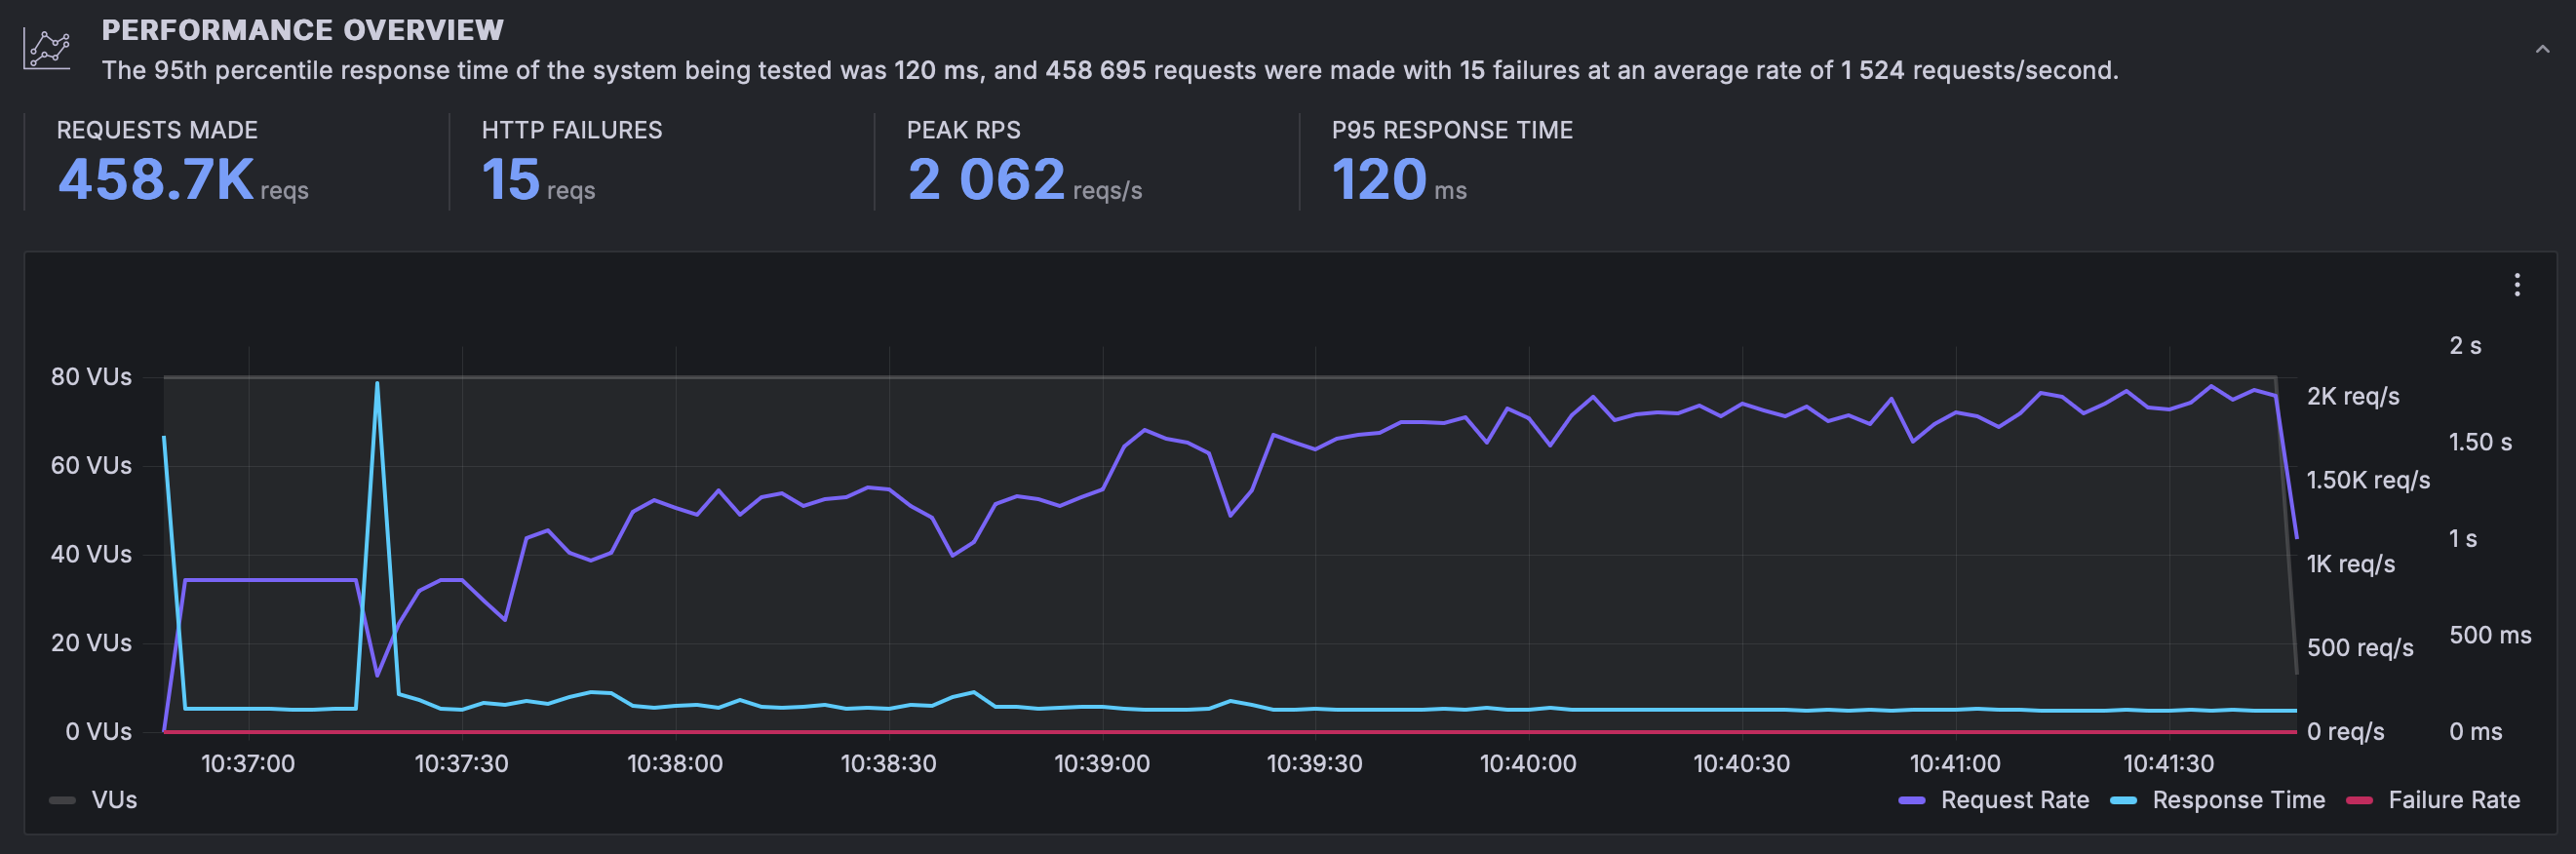
Now we can see how the same test behave differently from before:
- Up from 184.1k requests for the period to 278.9k, this is a 1.5x increase
- Our peak RPS went up from 841 to 1055, a 1.25x increase in RPS. However, RPS remains more stable over time compared to the previous scenario.
- P95 goes down to 114ms, but more importantly it is more stable than before.
The main take away from this graph is that the system increased resources allowing your application to remain stable. There is an initial shock in the graph as the system goes from 0 to a lot of requests but once the autoscaler starts spinning replicas to cope with the extra load the system achieves stability.
In addition, we can observe how the autoscaler behaved during the tests:
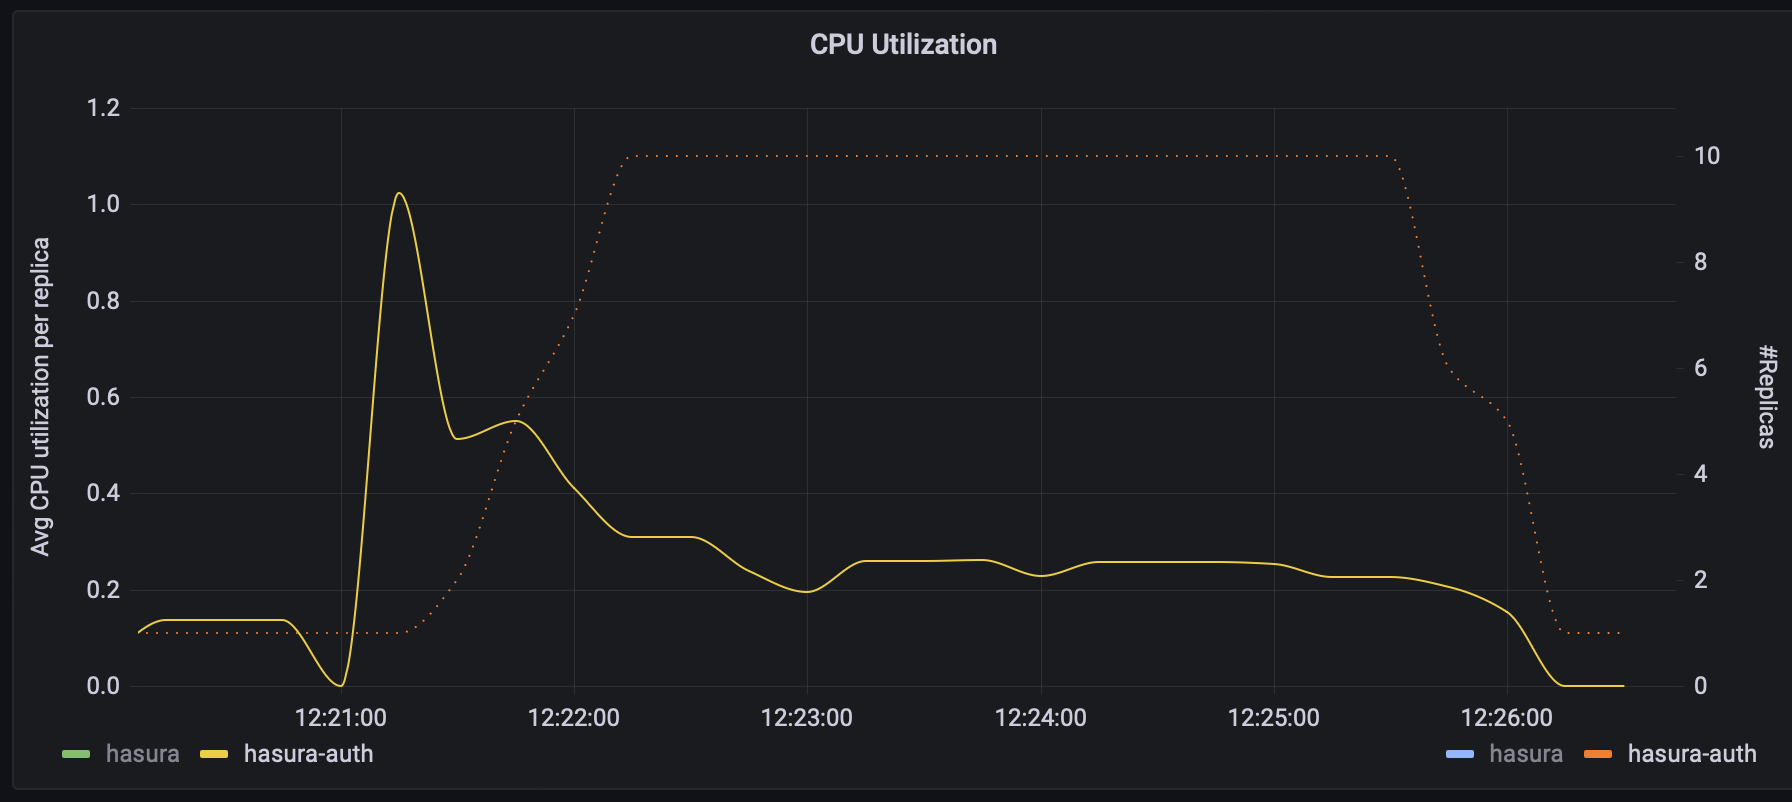 Average CPU Utilization per Replica vs # Replicas (auth)
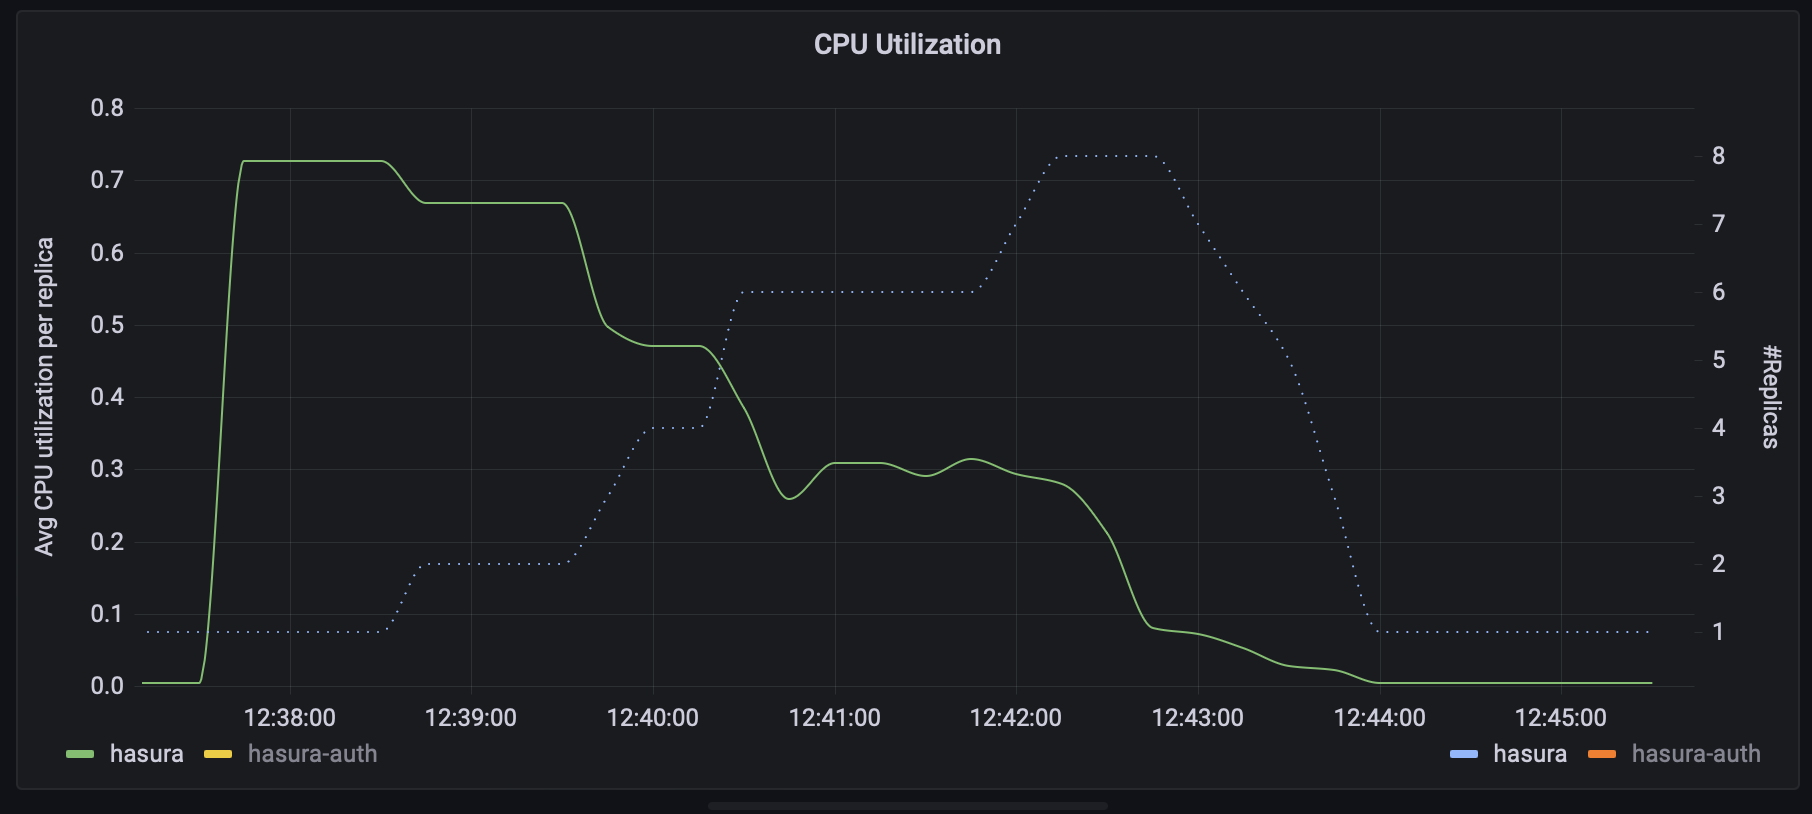
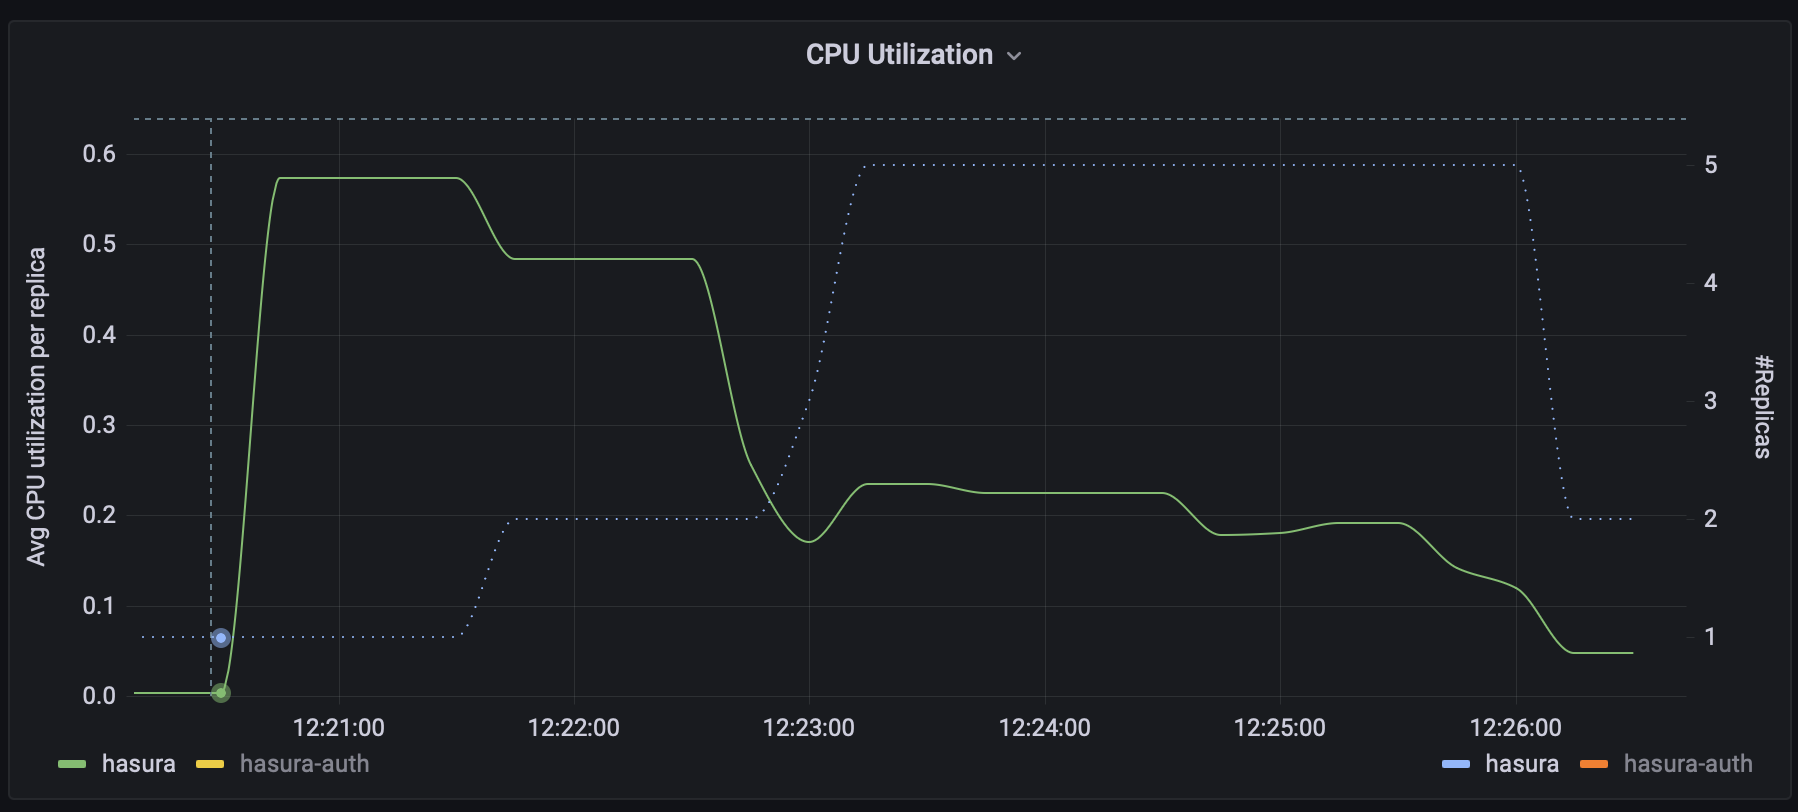 Average CPU Utilization per Replica vs # Replicas (hasura)
In the graphs above you can see how the autoscaler provisions extra replicas as each one exceeds their assigned resources and how they are decommissioned when they are no longer needed.
If you consider the amount of compute assigned to each service and the total number of replicas we can see that we achieved a sustained peak RPS of 1055 RPS with a P95 of 114ms with 5 cores (10 Auth replicas _ 0.25 cores + 5 Hasura replicas _ 0.5 cores)
Autoscaler, 80 workers, max 40 replicas
Just for fun, let's crank up the tests a bit. Similar scenario to before but with 80 workers:
 results with resources and 4x load
The results are unsurprising; twice the workers leads to twice the peak RPS. As the system takes longer to get to a stable state the number of total requests isn't quite double and the P95 suffers a slight hit but you can see all in all once the system becomes stable things just work(TM).
If you want to see the autoscaler's work, here are the graphs:
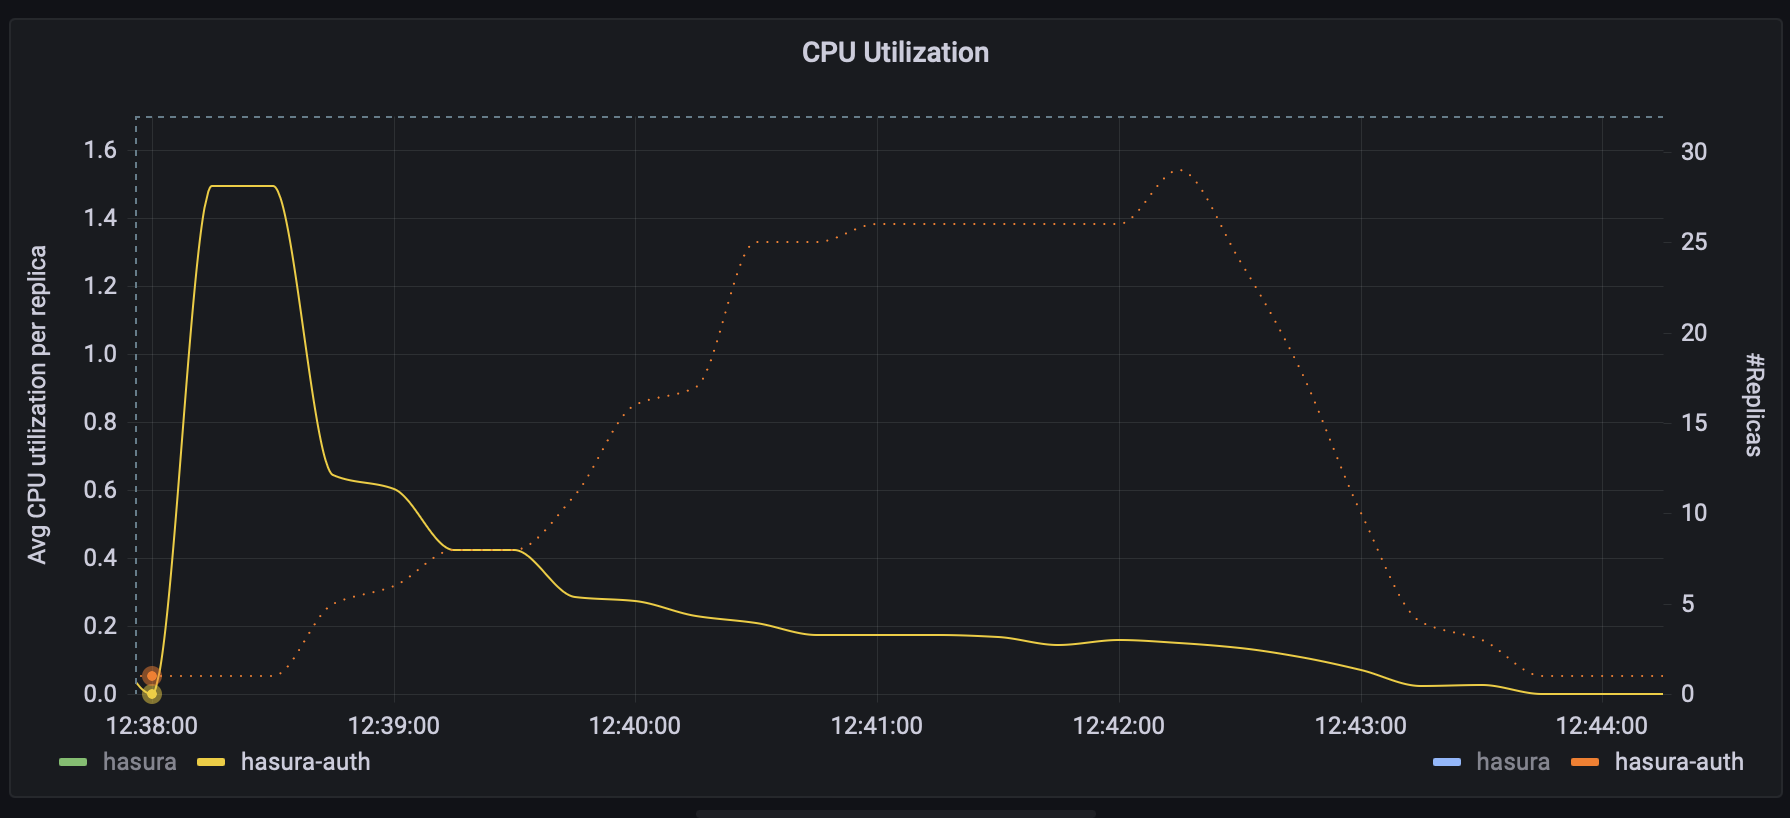 Average CPU Utilization per Replica vs # Replicas (auth)
 Average CPU Utilization per Replica vs # Replicas (hasura)
Totalling 15.5 cores.
Future work
The autoscaler is still work in progress, we are working with a select group of customers to develop it and test it, if you are interested in being involved and/or get early access don't hesitate to let us know.
Conclusion
Scaling infrastructure is hard. However, we are doing a lot of work to simplify it so you don't have to care much about it and to make sure you can grow and survive being featured on hackernews or reddit without requiring a cristal ball and/or having to overprovision, saving you money and headaches.
Share this post